Try it on your own data
Every report in this article is in the free plan. One snippet for web and apps, up to 10 sites.
Start freeOrdinal data is categorical data with a natural order but no known gaps: you can rank "happy" above "neutral", but not say by how much. That is why the median and the share in each level are safe summaries, while a mean quietly assumes equal steps. In the sample below, two groups swap places on the mean when the labels are renumbered, but not on the median.
What you will learn
- Report the median or the share in the top two levels, and show the full distribution beside it
- A comparison that flips when you renumber the labels was only ever about the numbers you chose
- Group NPS and bin sizes before scoring; do not average bins or compare 4.1 with 4.0 on a single item
What is ordinal data?
Ordinal data is categorical data whose categories have a natural order, but whose gaps are not known amounts. "Unhappy, neutral, happy" is ordinal: happy ranks above neutral, yet nothing says how much happier. A 5-star rating, a support priority (P1 to P3) and a plan tier (Free, Pro, Enterprise) behave the same way.
Two properties define it:
- Order exists. You can say one value is higher than another.
- Distance does not. The step from 1 to 2 stars is not guaranteed to equal the step from 4 to 5.
That second property drives everything in this guide. It is why you can find the middle value and count how many people chose each level, but should be cautious about adding values up and dividing. The wider family of data types is in data types; this page covers ordinal data in practice. See also ordinal variable and categorical variable.
How does ordinal differ from nominal, interval and ratio data?
Stevens (1946) sorted measurement into four levels, each allowing more arithmetic than the one before.
| Level | What you can say | Example | Sensible summary |
|---|---|---|---|
| Nominal | Same or different | Device type, country, plan name | Counts, share, mode |
| Ordinal | Higher or lower | Star rating, priority, plan tier | Median, percentiles, share per level, mode |
| Interval | How far apart, but no true zero | Temperature in °C, calendar date | Mean, standard deviation, differences |
| Ratio | How many times as much, true zero | Revenue, session duration, order count | Everything above, plus ratios |
Plan tier is a good test case. "Pro is above Free" is ordinal. "Pro costs $30 a month and Free costs $0" is ratio data about something else: price. The tier label and its price are two variables, and only the price can be averaged.
The same variable can sit at different levels depending on how you record it. Age in years is ratio; age band ("18–24", "25–34") is ordinal; once you bin, you cannot average the original ages back.
What are eight examples of ordinal data in products and support?
| # | Example | Levels | Watch out for |
|---|---|---|---|
| 1 | Star rating on an app or order | 1 to 5 stars | One-star and five-star clusters are common; the mean hides them |
| 2 | Support satisfaction score (CSAT) | 1 to 5 | Only people who answer are counted |
| 3 | Likert agreement item | Strongly disagree to strongly agree | Keep the scale length the same across surveys |
| 4 | NPS question | 0 to 10 | Usually grouped into detractors, passives and promoters before scoring |
| 5 | Bug severity | Low, medium, high, critical | Labels differ between teams |
| 6 | Support or task priority | P3, P2, P1 | "P1" means different things in different companies |
| 7 | Plan tier | Free, Pro, Enterprise | Order is by tier, not necessarily by value to you |
| 8 | Company size band | 1–10, 11–50, 51–200, 201+ | Bins of a ratio variable; unequal widths |
All eight can be sorted, and none has a gap you can state exactly. For the first three, see also improve CSAT.
| Level | What you can say | Sensible summary |
|---|---|---|
| Nominal | Same or different | Counts, share, mode |
| Ordinal | Higher or lower | Median, percentiles, share per level |
| Interval | How far apart | Mean, standard deviation |
| Ratio | How many times as much | Everything above, plus ratios |
Each level allows the arithmetic of the levels above it in the table.
Which summary should you use? A worked example
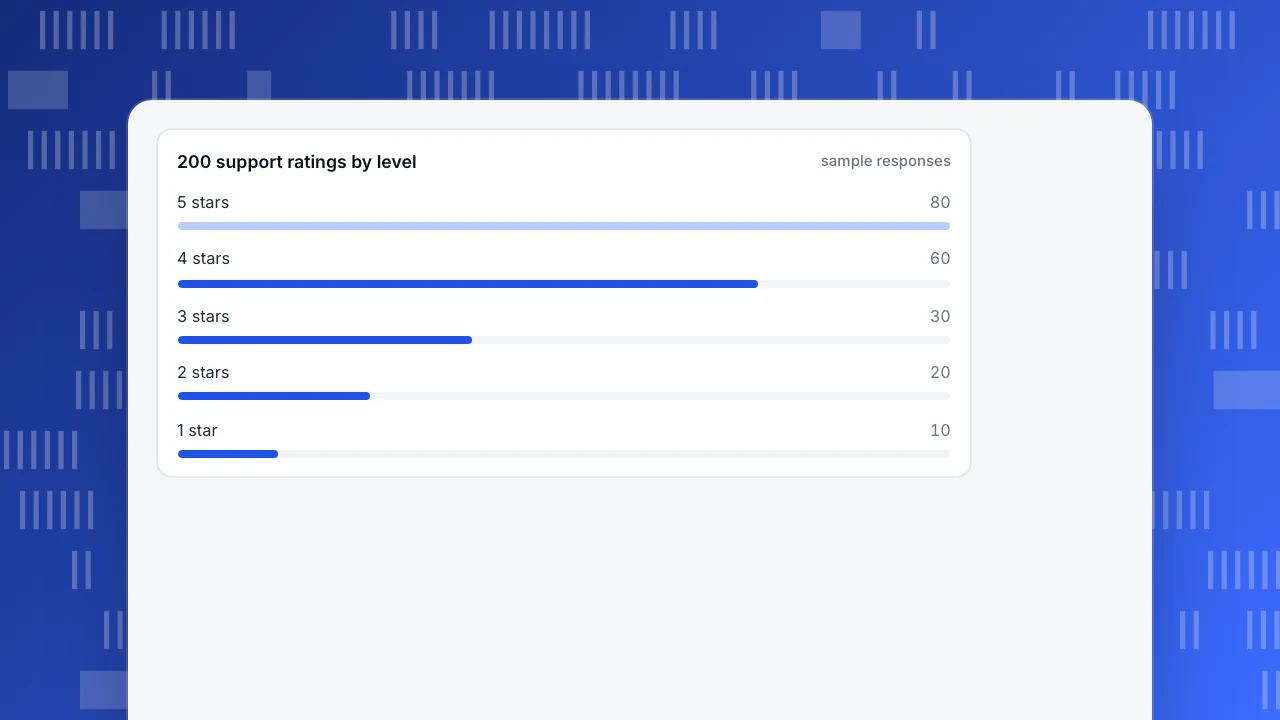
Sample data: 200 customers rated a support experience from 1 to 5.
| Rating | 1 | 2 | 3 | 4 | 5 | Total |
|---|---|---|---|---|---|---|
| Responses | 10 | 20 | 30 | 60 | 80 | 200 |
- Mean: (1×10 + 2×20 + 3×30 + 4×60 + 5×80) ÷ 200 = 780 ÷ 200 = 3.90
- Median: the 100th and 101st sorted responses are both 4 (cumulative counts: 10, 30, 60, 120, 200), so the median is 4
- Top-2 share: (60 + 80) ÷ 200 = 70%
- Bottom-2 share: (10 + 20) ÷ 200 = 15%
The mean and median agree here, so this alone would not worry anyone. Now compare with a second group, B, whose responses are 20, 20, 20, 50 and 90.
| Mean (1–5 coding) | Mean (1, 2, 3, 4, 10 coding) | Median | Top-2 share | Bottom-2 share | |
|---|---|---|---|---|---|
| A | 3.90 | 5.90 | 4 | 70% | 15% |
| B | 3.85 | 6.10 | 4 | 70% | 20% |
Both codings keep the order 1 < 2 < 3 < 4 < 5, so both are valid ways to number an ordinal scale. Under the usual 1–5 coding, A has the higher mean (3.90 against 3.85). Recode the top level as 10 instead of 5 and B overtakes A (6.10 against 5.90). A comparison that flips when you renumber the labels was never about the data, only about the numbers you chose. The median is 4 under every valid coding, and the top-2 share is 70% for both, so neither says one group is happier. The bottom-2 share does: 20% of B's customers rated 1 or 2, against 15% of A's.
The practical rules:
- If you must give one number, give the median, or the share in the top two (or bottom two) levels.
- Always show the full distribution next to it, as in the first table.
- If you report a mean, because stakeholders expect it, do not rank groups by a 0.05 difference.
This is not universally agreed. Many practitioners report Likert means and Jamieson (2004) argues that is inappropriate for single items. Liddell and Kruschke (2018) show that treating ordinal ratings as metric can produce systematic errors, including reversed orderings of group means, as the example above illustrates in miniature.
200 support ratings by level
sample responsesWhat does a decision rule on ordinal data look like?
Pick two shares instead of one average, so the rule cannot be gamed by a few extreme answers. For example: "at least 70% of responses at 4 or 5, and no more than 15% at 1 or 2." Applied to the two groups above:
| Group | Top-2 share | Bottom-2 share | Passes both? |
|---|---|---|---|
| A | 70% | 15% | Yes |
| B | 70% | 20% | No: bottom-2 is over 15% |
B fails because of its unhappy tail, which a mean of 3.85 against 3.90 would have buried in a rounding difference. Write the thresholds down before you see the next month's data, and check the response count first: a share from 12 responses can swing by 8 points on one answer (1 ÷ 12 = 8.3%). The thresholds here are examples, not benchmarks; set yours from your own history.
How should you chart ordinal data?
- Use a bar per level, in order. Put levels in their natural order, not alphabetical or by size. A stacked bar of all 5 levels per group lets you compare shapes.
- Use one colour that gets darker, or two that diverge from the middle. Sequential colour for low-to-high, diverging for negative-to-positive scales. Do not use unrelated colours for ordered levels.
- Avoid a line connecting the levels. A line implies equal steps between categories.
- Avoid a pie chart. Order matters, and a pie hides it.
- Label counts as well as percentages. 70% of 10 is not 70% of 1,000.
Which mistakes come up most often?
- Averaging a single rating item and comparing two decimals. 4.1 against 4.0 may be noise or a change in distribution, and the number cannot tell you which.
- Treating "NPS" as a mean. Group the 0–10 answers first, then compute the score.
- Mixing scale lengths. A 5-point average is not comparable with a 7-point one. Compare shares in matching top and bottom bands.
- Ignoring non-response. If 6% of customers rate, you have ranked a self-selected few; see selection bias.
- Calling bins numeric. Company-size bands are ordinal. Do not report an "average band 2.4".
- Using the mean to answer "how many". Questions like "how many are unhappy" need a share, not a mean.
For the general mean-versus-median choice, see mean vs median.
How do you work with ordinal data in TapCub?
Start with the support satisfaction example. TapCub records a satisfaction score from 1 to 5 within 24 hours after a conversation is resolved, one score per conversation, and the reports show it averaged to one decimal.
- Read the average as a hint. In Live chat › Reports, the satisfaction number is the average of those scores. By the logic above, treat it as a signal to look deeper rather than a ranking of agents.
- Look at the per-person split carefully. Agent workload includes satisfaction per person. An agent with five scores and an agent with fifty are not comparable on a decimal.
- Track your own ratings as events. TapCub does not run surveys. If your product collects a rating, send it as an event with a numeric property, such as
rating. In All-platform analytics › Behavior › Behavior analysis, the distribution view with Property value shows how many ratings fell on each value. - Summarise with a median, not just a mean. In All-platform analytics › Behavior › Metrics & SQL, define a custom metric from the event with an aggregation such as median, or query the events directly with SQL, and put the share of 4–5 ratings beside it.
- Segment before you compare. Use All-platform analytics › Users › Segments & tags to compare ratings between new and returning users, or channels, and confirm the group sizes first.
FAQ
What is ordinal data in simple terms?
Ordinal data is a set of categories you can rank but cannot measure the gaps between. Satisfaction levels, star ratings and priority labels are typical. You know 5 stars beats 4, but not by how much.
Can you calculate the mean of ordinal data?
You can compute it, and many people do, but it assumes equal gaps between levels, which ordinal data does not guarantee. Prefer the median and the share in each level, and report the full distribution if you also give a mean.
Is a Likert scale ordinal data?
A single Likert item (agree to disagree) is ordinal. Some analysts treat the sum or mean of several items as approximately numeric; that is a judgement call that depends on the scale and the question, so say that you are doing it.
What is the difference between ordinal and nominal data?
Nominal categories have no order (device type, country). Ordinal categories do (low, medium, high). Both are categorical, but only ordinal supports a median or a "top two levels" share.
Is NPS ordinal data?
The 0–10 answers are ordinal. The Net Promoter Score groups them into three bands and subtracts the share of detractors from the share of promoters, which is a calculation on shares rather than a mean of the answers.
See also: Data Examples: Types of Data With Real Analytics Rows and What You Can Do With Each.
Sources
- Stevens, S. S. (1946). On the Theory of Scales of Measurement. Science, 103(2684), 677–680.
- Jamieson, S. (2004). Likert scales: how to (ab)use them. Medical Education, 38(12), 1217–1218.
- Liddell, T. M., Kruschke, J. K. (2018). Analyzing ordinal data with metric models: What could possibly go wrong? Journal of Experimental Social Psychology, 79, 328–348.
Was this article helpful?
We use your answers to fix and expand this page.
Couldn’t send. Please try again in a minute.
Thanks for the feedback. We’ll use it to improve this page.You’ve already sent feedback on this page. Thanks.

Technical Engineer
Focuses on tracking code, SDKs, and API integrations, with practical guidance on implementation checks and troubleshooting.