Try it on your own data
Every report in this article is in the free plan. One snippet for web and apps, up to 10 sites.
Start freeExamples of data include a page URL, a country, a load time of 2.4 seconds, a satisfaction rating of 4 out of 5, a yes-or-no conversion and a free-text comment: each is a different type, and the type decides which summary is valid. This guide classifies one real-looking analytics event row into eight types, shows what each allows and what to avoid, and works a sample where the mean (144.3 s) and the median (42 s) of the same ten sessions disagree.
What you will learn
- One event row holds eleven fields of eight types; the type decides the summary, the chart and the mistake to avoid
- Use median or a high percentile for skewed numbers (42 s median vs 144.3 s mean), counts and shares for categories, and a rate for yes-or-no fields
- Never average identifiers, be careful averaging ordinal ratings, and keep field types and units fixed so the data stays usable
What does one row of data look like, and what types are in it?
Data is a recorded fact about something: a number, a label, a time, a piece of text. One row from a website's event log already contains most of the types you will meet. Sample data:
| Field | Value | Type |
|---|---|---|
| timestamp | 2026-11-12 09:14:03 | Date and time |
| visitor_id | v_8f2a | Identifier |
| event | page_view | Nominal (a category) |
| page | /pricing | Nominal |
| country | US | Nominal, geographic |
| device | mobile | Nominal |
| load_time_s | 2.4 | Continuous number |
| pages_in_session | 3 | Discrete count |
| satisfaction | 4 (on a 1 to 5 scale) | Ordinal |
| converted | false | Binary |
| referrer_text | "from the newsletter" | Unstructured text |
One record, eleven fields, eight different types. The rest of this guide explains what each type allows, because the type decides which summary and which chart are valid. For the broader definition, see data types.
What is the difference between qualitative and quantitative data?
Quantitative data is numeric and measured: load time, pageviews, revenue. Qualitative (categorical) data describes a quality or label: country, device, a rating description, a comment. The split matters because arithmetic only works on the first kind.
| Quantitative | Qualitative | |
|---|---|---|
| Examples | Sessions per day, order value, page load time | Traffic source, browser, review text |
| Asks | How many? How much? How long? | Which kind? What was said? |
| Summary | Mean, median, percentiles, sum | Count, share, most common value |
| Chart | Line, histogram, scatter | Bar, stacked bar |
Many fields are in between. A satisfaction score from 1 to 5 is stored as a number but behaves as a ranked category, which is why it gets its own row in the next table. For ordered categories in detail, see ordinal data examples.
What are the main types of data, with examples and what to do with each?
| Type | Analytics example | What you can do | What to avoid |
|---|---|---|---|
| Nominal | Browser, country, traffic source | Count, share, most common value | Averaging; ranking as if it has an order |
| Ordinal | Satisfaction 1 to 5; plan tier Free < Pro < Enterprise | Median, mode, distribution, comparing ranks | Assuming the gap between 1 and 2 equals the gap between 4 and 5 |
| Discrete (count) | Pageviews per session, events per user | Sum, mean, median, histogram | Reporting "2.4 pageviews" as a single visit's value; it is an average |
| Continuous | Session duration, page load time, order value | Mean, median, percentiles, correlation | Quoting the mean alone when values are skewed |
| Binary | Converted yes or no | Rate (the mean of 0 and 1), comparing rates | Summing it without stating the denominator |
| Time series | Daily visitors, weekly revenue | Trend, moving average, seasonality | Treating each day as independent |
| Identifier | visitor_id, order_id | Count distinct values, join tables | Averaging or summing IDs |
| Unstructured text | Chat messages, search queries, feedback | Tag themes, count mentions, search | Counting words as if they were measures |
The most common mistakes come from the "avoid" column: averaging an ordinal rating, quoting a mean for a skewed duration, or reporting a rate without its denominator.
| Type | Analytics example | What you can do | What to avoid |
|---|---|---|---|
| Nominal | Browser, country, source | Count, share, mode | Averaging |
| Ordinal | Satisfaction 1 to 5 | Median, mode, distribution | Assuming equal gaps |
| Discrete (count) | Pageviews per session | Sum, mean, median | Treating the mean as one visit's value |
| Continuous | Session duration, load time | Mean, median, percentiles | Mean alone when skewed |
| Binary | Converted yes or no | Rate, compare rates | A rate without its denominator |
| Identifier | visitor_id | Count distinct, join | Summing or averaging |
Sample data. The same types apply in any analytics tool; the aggregation that fits each is shown in the guide.
What is the difference between structured, semi-structured and unstructured data?
This split is about format, not meaning. IBM's explanation gives the working definitions: structured data has a fixed schema and fits into rows and columns; unstructured data has no fixed schema and includes emails, images and video; semi-structured data has no predefined data model but uses metadata such as tags to organise content into records and fields.
| Format | Analytics example | How you query it |
|---|---|---|
| Structured | An events table with one column per field | SQL, standard reports |
| Semi-structured | An event's properties stored as key-value pairs (JSON) | Extract the key you need, then treat as structured |
| Unstructured | A chat transcript, an open-ended survey answer | Search, tag, or summarise before counting |
Semi-structured data has limits that matter. For example, Google's analytics documentation limits each event to 25 event parameters, with event names of up to 40 characters and parameter values of up to 100 characters (with exceptions for a few fields such as page location). A property you keep stuffing with long text will be cut off; keep each value short, and put long text where it can be stored and searched.
How do you choose the right statistic? A worked example
Sample data: ten sessions' durations in seconds, and ten satisfaction ratings.
| Data | Values | Mean | Median | Mode |
|---|---|---|---|---|
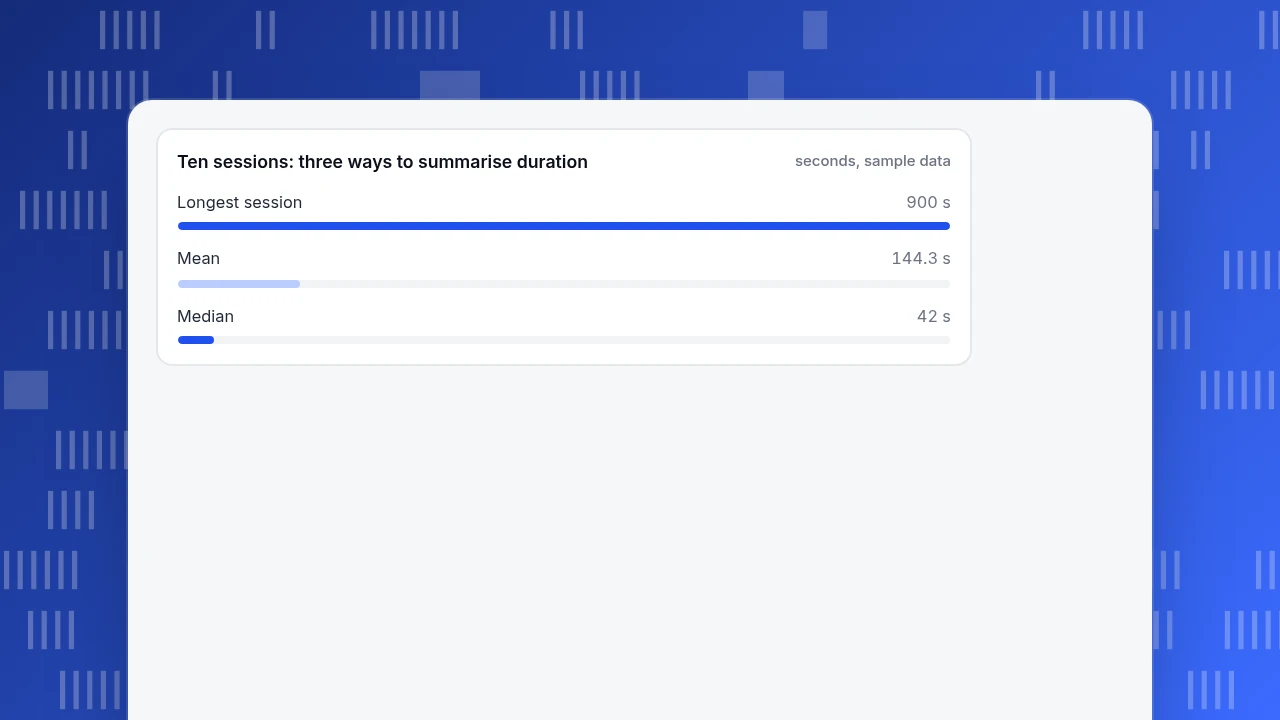
| Session duration (s) | 12, 18, 25, 31, 40, 44, 58, 75, 240, 900 | 144.3 | 42 | none |
| Satisfaction (1 to 5) | 5, 5, 4, 5, 2, 4, 5, 1, 5, 3 | 3.9 | 4.5 | 5 |
Recompute the first: the sum is 1,443 and 1,443 ÷ 10 = 144.3 seconds, but eight of the ten sessions are shorter than that; the median, the average of the 5th and 6th sorted values (40 and 44), is 42 seconds. Two long sessions (240 and 900) pulled the mean up. For skewed durations, report the median and a high percentile.
For the ratings, the sorted values are 1, 2, 3, 4, 4, 5, 5, 5, 5, 5, so the median is (4 + 5) ÷ 2 = 4.5 and the most common rating is 5. The mean of 3.9 is widely used for ratings, but it assumes equal gaps between steps; reporting the distribution (five 5s, two 4s, one 3, one 2, one 1) is safer.
Last, time series: seven days of visitors (1,200, 1,350, 1,280, 1,410, 1,500, 980, 870) sum to 8,590, a 7-day average of 1,227.1. The weekend drop (980 and 870) is the pattern; a single day's number tells you much less than the week's shape.
Ten sessions: three ways to summarise duration
seconds, sample dataWhere does data come from?
Two origins cover most of what you will analyse. First-party data is what you collect yourself: your own events, orders and support messages. Published data comes from outside, such as government statistics. The U.S. Census Bureau's American Community Survey, for example, is an ongoing survey that provides information every year on topics such as jobs and occupations, educational attainment, veterans, and whether people own or rent their homes. Published data is useful for context (how big is the market?), and first-party data for decisions (what did our visitors do?). Check the date and the definition on any published figure before you compare it with yours.
How do you record data so it stays usable?
Five rules, each with a reason.
- One meaning per field. A field that holds "mobile" on some rows and a screen width on others cannot be analysed.
- Put the unit in the name.
load_time_sandorder_value_usdprevent a seconds-versus-milliseconds error. - Fix the type. A property that is a number in one release and a text string in the next splits into two columns when you query it.
- Name events and properties consistently, and keep within the platform's limits (25 parameters, 40-character names).
- Decide what is an identifier. Identifiers are for joining and counting distinct values; never for averages.
The difference between a badly and a well designed field shows in three rows (sample):
| Badly designed | Well designed | Why it is better |
|---|---|---|
time: sometimes 2.4, sometimes 2400 | load_time_s: always seconds, always a number | Fixed unit and type, so means and percentiles mean something |
rating: "4", "four stars", "good" | satisfaction: an integer from 1 to 5 | An ordered category can be sorted and its median computed |
user: sometimes an email, sometimes a number | visitor_id plus a separate plan field | The identifier is only for joining; the category lives on its own |
How do you work with data types in TapCub?
Take the session-duration example. TapCub gives you the aggregations that fit each type, so you do not have to reach for the mean by default.
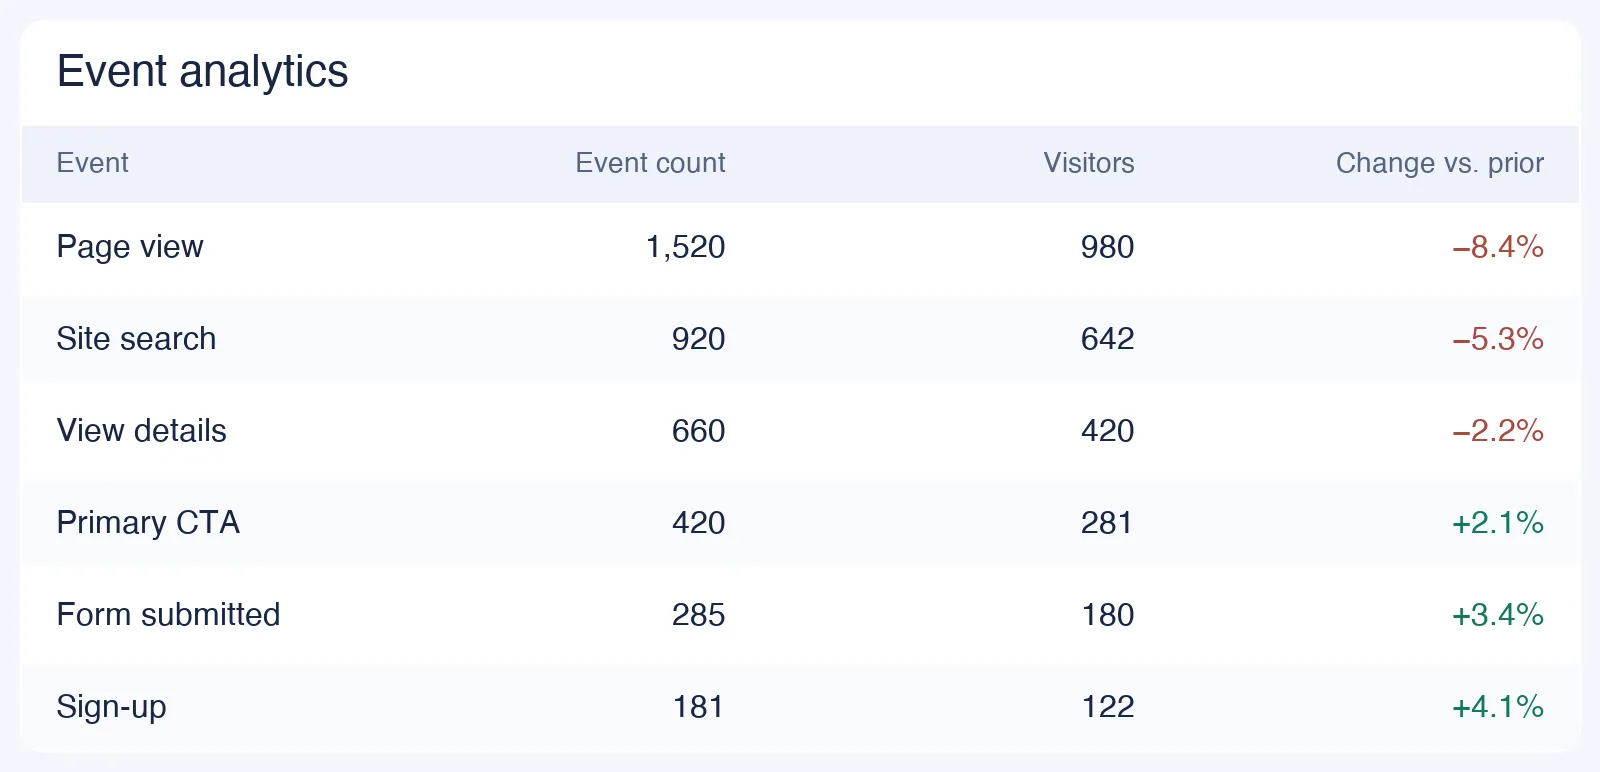
- Define the event and its properties with types. In All-platform analytics › Data › Tracking plan, record the event name, the properties (name, type, required or not, description and an example), the platform and an owner. This is the written definition of the fields in the first table.
- Check that it arrives. Turn on the real-time validation (last 24 hours) for the event, which shows each event's arrivals and how complete the required properties are. New events that were not planned go to All-platform analytics › Data › Event inbox until someone claims them.
- Pick the aggregation that matches the type. In All-platform analytics › Behavior › Behavior analysis, event aggregations include total, uniques and average per subject, and, for a numeric property, sum, average, median, 90th percentile, distinct count, minimum and maximum. For skewed durations choose median or the 90th percentile; for binary fields, a rate.
- Break down by the nominal fields. Break the same measure down by device, source or country, with up to three layers.
- Take out the rows when you need them. For raw rows, use an asynchronous export under All-platform analytics › Data › Data export; the console reports are aggregates.
FAQ
What are examples of data?
Examples of data include a page URL, a country, a load time of 2.4 seconds, a satisfaction rating of 4 out of 5, a yes-or-no conversion and a free-text comment. Each is a different type, as in the event row above, and each allows different summaries.
What are the 4 main types of data?
The four levels of measurement are nominal (labels, such as country), ordinal (ranked, such as ratings), interval (numbers with equal steps but no true zero, such as temperature in Celsius) and ratio (numbers with a true zero, such as duration or revenue). In analytics work, "discrete" and "continuous" are the other common split.
What is an example of quantitative data?
Session duration, order value, pageviews per session and load time. These are numbers you can add and average. In the sample, ten session durations total 1,443 seconds, a mean of 144.3 and a median of 42.
What is an example of qualitative data?
Traffic source, browser, country and open-ended feedback. These describe a quality or label, so you count and compare shares rather than average them.
What is the difference between structured and unstructured data?
Structured data has a fixed schema and fits into rows and columns, such as an events table. Unstructured data has no fixed schema, such as chat transcripts, emails and images. Semi-structured data sits between, with tags or keys that organise it.
What is an example of data that should not be averaged?
An identifier, a nominal category and, with care, an ordinal rating. Averaging visitor IDs is meaningless, and a mean rating of 3.9 hides whether people split between 1 and 5. Report counts, shares or the distribution.
Sources
- Penn State (GEOG 160). 4.2 Attribute Measurement Scales — nominal, ordinal, interval and ratio levels. Verified 2026-11-20.
- IBM. Structured vs. unstructured data — definitions of structured, semi-structured and unstructured data. Verified 2026-11-20.
- Google Analytics Help. Collection limits — 25 event parameters, 40-character event names, 100-character parameter values. Verified 2026-11-20.
- U.S. Census Bureau. About the American Community Survey — an ongoing annual survey on jobs, education, veterans and housing tenure. Verified 2026-11-20.
Was this article helpful?
We use your answers to fix and expand this page.
Couldn’t send. Please try again in a minute.
Thanks for the feedback. We’ll use it to improve this page.You’ve already sent feedback on this page. Thanks.

Product Experience Specialist
Writes about product experience, practical workflows, and growth, turning complex processes into clear steps for everyday decisions.