Try it on your own data
Every report in this article is in the free plan. One snippet for web and apps, up to 10 sites.
Start freeThe DAU/MAU ratio is distinct users active on a day divided by distinct users active over 30 days, and it equals the average active days per monthly user divided by 30. A 37% ratio means about 11 active days a month. Below: real filings, why growth lowers the ratio and what to compare it with.
What you will learn
- DAU/MAU × 30 is the average number of active days per monthly user, so 20% means about 6 days a month
- The same ratio can hide very different usage: 1,000 users active 10 days each and 200 daily users plus 800 occasional ones both give 33.3%
- Judge the ratio against a ceiling set by how often the product is meant to be used, and split new users from established ones
What the DAU/MAU ratio measures
DAU/MAU divides the number of distinct users active on a day by the number of distinct users active over the last month. It answers one question: on a typical day, what share of the people who use the product this month show up?
Google Analytics states the windows plainly: DAU is the active users in the last 24 hours, WAU the last 7 days and MAU the last 30 days, and "if users engaged with your website or app daily, the ratio will be 100%." Whether you read it as stickiness or as a daily habit score, the number has one useful reading:
DAU/MAU × 30 = the average number of days per month each monthly user is active.
That identity holds because average DAU is the total of user-days divided by 30, and MAU is the number of users. A ratio of 20% means the average monthly user is active about 6 days out of 30; 50% means about 15. Everything else in this article, including why two apps can share a ratio and why growth lowers it, follows from that sentence.
Before any calculation you need two decisions, covered below: what counts as "active" and which 30-day window MAU uses.
How to calculate DAU/MAU with real numbers
The formula is DAU ÷ MAU, read as a percentage. Two companies publish both numbers, so you can check the arithmetic yourself.
| Company and period | DAU | MAU | DAU/MAU | Days active per month |
|---|---|---|---|---|
| Duolingo, quarter ended 30 September 2025 | 50.5 million | 135.3 million | 37.3% | about 11.2 |
| Duolingo, quarter ended 30 September 2024 | 37.2 million | 113.1 million | 32.9% | about 9.9 |
| Facebook, December 2023 | 2.11 billion | 3.07 billion | 68.7% | about 20.6 |
Duolingo's quarterly filing defines DAUs as unique users who engage with the app or the learning section of its website each calendar day, and MAUs as unique users who engage each month, and reports the ratio itself: 37.3%, up from 32.9% a year earlier. Meta's December 2023 release gives Facebook 2.11 billion daily active users and 3.07 billion monthly active users, which divides to 68.7%.
Read the Facebook row with one caveat. Meta says DAUs are an average for the month while MAUs are a figure as of the last day of the month, so the ratio mixes an average with a point-in-time count. Your own calculation should use one rule for both numerator and denominator, as the next section explains. These are two public data points, not a benchmark: one is a daily-habit learning product, the other a social network, and neither looks like your product.
What counts as active and which window to use
Three choices change the ratio more than any product change does. Write them down once and keep them.
- The active event. An app open is generous; a meaningful action such as completing a lesson, sending a message or placing an order is strict. A loose definition counts more people on more days, which tends to raise the ratio. Compare only ratios built on the same event.
- Rolling 30 days or calendar month. Google defines MAU as the last 30 days, which rolls forward each day. A calendar-month MAU resets on the 1st, so the ratio jumps at month boundaries and is not comparable between a 28-day February and a 31-day March. A rolling window avoids that.
- Daily average or a single day. A single day's DAU swings with the weekday. Use the average DAU across the 30 days of the window, so the numerator covers the same period as the denominator.
If you only have one number to fix first, fix the third. A product with weekday usage can show a much higher single-day ratio on a Wednesday than on a Sunday and still be perfectly stable.
Two products with the same ratio
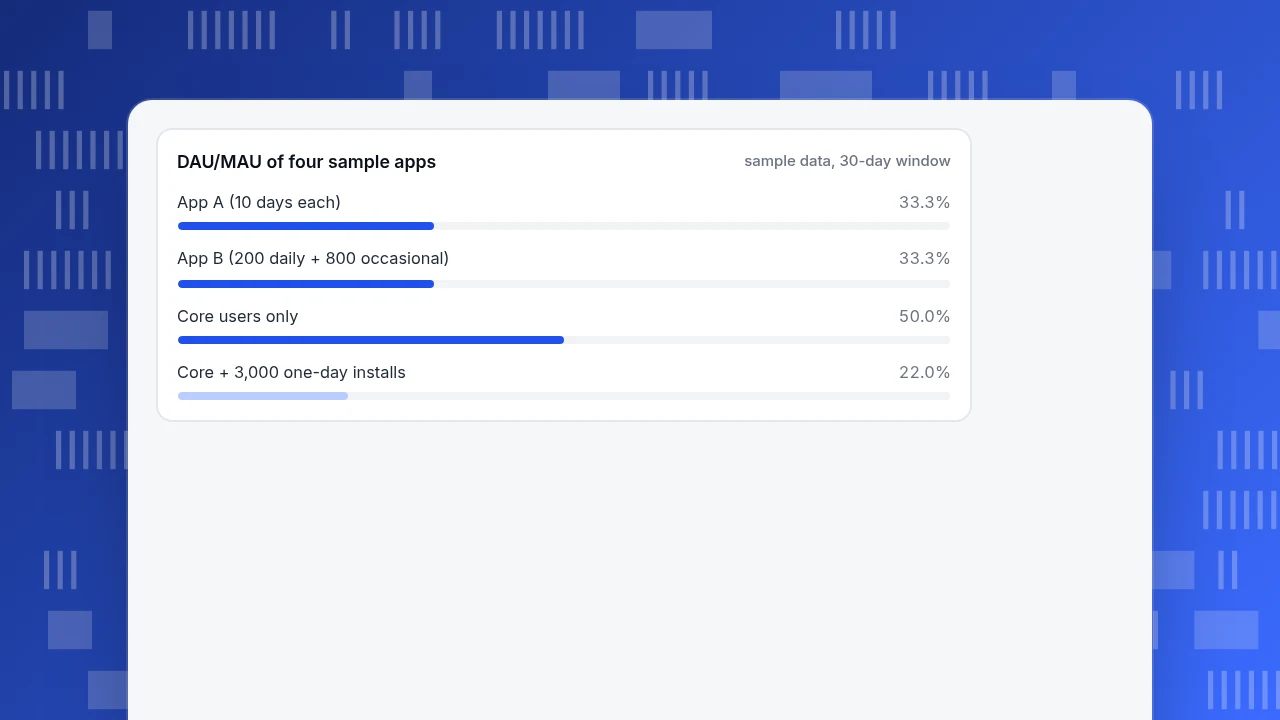
A single ratio hides how usage is spread. Sample data below, recomputed from a 30-day activity log:
- App A: 1,000 monthly users, each active exactly 10 days out of 30.
- App B: 1,000 monthly users. 200 are active all 30 days and 800 are active only 5 days.
Both have average DAU of 333.3 and MAU of 1,000, so both show 33.3%. But App A has no habitual users at all (nobody is active more than 10 days), while App B has a core of 200 people who use it every day and a long tail who barely do. B's total (200 × 30 + 800 × 5 = 10,000 user-days) equals A's (1,000 × 10 = 10,000 user-days), which is why the ratio cannot tell them apart.
What does tell them apart is the distribution of active days per user: how many people were active on 1 day, 2 days, and so on up to 30. That is often called a stickiness histogram or an L-ratio table. If you can only report one extra number beside DAU/MAU, report the share of monthly users active on at least 15 of the 30 days: 0% for App A, 20% for App B.
| Scenario | Monthly users | Average DAU | DAU/MAU | Active 15+ days |
|---|---|---|---|---|
| App A: every user 10 days | 1,000 | 333.3 | 33.3% | 0 (0%) |
| App B: 200 daily + 800 for 5 days | 1,000 | 333.3 | 33.3% | 200 (20%) |
| Core users only | 2,000 | 1,000.0 | 50.0% | 2,000 (100%) |
| Core plus a 3,000-install campaign | 5,000 | 1,100.0 | 22.0% | 2,000 (40%) |
Sample data: average DAU is user-days ÷ 30. The ratio alone cannot tell App A from App B; the share active 15+ days can.
Why the ratio falls when you grow
DAU/MAU can drop when the product is getting better, because new users enter MAU on day one but have not yet formed a habit. Sample data:
- Before the campaign: 2,000 core users, each active 15 days a month. Average DAU 1,000, MAU 2,000, ratio 50.0%.
- A campaign brings 3,000 installs, each active only on the day they install. MAU becomes 5,000. Average DAU becomes (2,000 × 15 + 3,000 × 1) ÷ 30 = 1,100.
- The ratio is now 1,100 ÷ 5,000 = 22.0%.
Nothing about the core users changed. The ratio fell 28 points because the denominator absorbed 3,000 one-day visitors. The fix is not to hide the number but to split it: calculate DAU/MAU separately for users who joined more than 30 days ago (the established group, 50.0% in this example) and for users who joined in the last 30 days. Report both, and judge the product on the established group while judging the campaign on whether its installs become established.
The opposite also happens. After a campaign ends, the one-day users fall out of MAU 30 days later and the ratio recovers without any product change. A dip and recovery with that shape is a campaign effect, not a retention effect.
DAU/MAU of four sample apps
sample data, 30-day windowWhat is a good DAU/MAU ratio?
There is no universal answer, and published "good" ranges rarely say how active was defined. A useful rule starts from how often the product is meant to be used:
Ceiling ratio = expected active days per month ÷ 30.
| Product rhythm | Expected active days | Ceiling | What the ratio means |
|---|---|---|---|
| Daily habit (messaging, language practice) | 30 | 100% | Compare with your own past; the two filings above show 37% and 69% |
| Weekday tool (work software) | about 21.4 | about 71% | Weekends cap it near 70% |
| Weekly use (meal planning, fitness check-in) | about 4.3 | about 14.3% | A 14% ratio is already at the ceiling |
| Monthly task (billing, tax, statement) | 1 | 3.3% | A 3% ratio is the product working |
Efficiency is actual ÷ ceiling. A weekly-use product at 10% reaches 10 ÷ 14.3 = 70% of its ceiling; a daily-habit product at 35% reaches 35% of its. The first is the stronger result even though its raw ratio is under a third as large. If your product is not meant to be opened daily, DAU/MAU is the wrong headline number, and WAU/MAU or the share of users active in a given week is the honest one.
Three measures answer the cases where DAU/MAU misleads: weekly retention (do the same people return), active days per user (the histogram above) and, for products with seasonal use, the same-month-last-year ratio. The metrics overview is at app engagement metrics, and the definition lives on the DAU/MAU glossary page.
How to read DAU/MAU in TapCub
Take the sample app above and work through it in TapCub for an iOS, Android or mini program project.
- Read the two numbers. Open App analytics › Users › Users and switch the header to active users. The tab draws daily, weekly and monthly active users. Weekly is the 7 days ending on the last day of the range, monthly is the 30 days ending that day, and the daily-active card shows the daily average over the range. Active means a start or a screen view in range. Divide the daily average by the monthly figure on the last day of the range to get DAU/MAU on one consistent rule.
- See the distribution. In All-platform analytics › Behavior › Behavior analysis, open the Lifecycle view and choose a period of week or month. Stickiness shows how many people were active on N days in the period, with a share, which is the histogram that separates App A from App B. You can also pick one event name as the activity definition, so only days with that event count. See read the lifecycle report.
- Split new from established. The Lifecycle view has an established cutoff, 7 days by default and adjustable from 1 to 90. People whose first day in the range falls within the cutoff count as new and the rest as established, and both numbers sit beside the chart. Set it to 30 days to recreate the established-versus-new split above.
- Check whether the same people return. App analytics › Users › Retention has active retention, which starts from the people active in a period and asks whether they are active later. Cells that are not due yet are marked as not due, not zero.
- Check active users in the app with check active users.
TapCub reports these figures; it does not decide what counts as a good ratio for your product. Use the ceiling rule above, and compare against your own history first.
FAQ
What is a good DAU/MAU ratio?
It depends on how often the product is meant to be used. Divide the active days you expect per month by 30 to get the ceiling: about 14% for weekly-use products, about 71% for weekday tools and 100% for daily habits. Duolingo reported 37.3% in the quarter ended 30 September 2025. Compare your ratio with your own past before any outside figure.
How do you calculate the DAU/MAU ratio?
Count distinct users active on each day of a 30-day window and average them to get DAU. Count distinct users active at least once in the same 30 days to get MAU. Divide DAU by MAU. For example, 50.5 million DAU against 135.3 million MAU gives 37.3%. Use the same active event and window for both numbers.
What is the difference between DAU/MAU and DAU/WAU?
Both measure how often active users return, over different windows. DAU/WAU compares daily users with users active in the last 7 days and WAU/MAU compares weekly with monthly. Google Analytics reports all three ratios. A product used a few times a week reads poorly on DAU/MAU but well on WAU/MAU, so match the ratio to the expected rhythm.
Why is my DAU/MAU ratio dropping?
The common cause is growth: new users join MAU on day one without yet being daily users. In the example above, 3,000 one-day installs took a 50.0% ratio to 22.0% with no change in core usage. Split users who joined more than 30 days ago from newer users and compare each group with its own past.
Can DAU/MAU be above 100%?
Not with a consistent definition, because every daily active user is also a monthly active user. A figure above 100% means DAU and MAU were counted differently, for example a daily average against a month-start count, or different identity rules. Check that both use the same active event, identity and window.
Sources
- Duolingo, Inc., Form 10-Q for the quarter ended 30 September 2025: DAU, MAU and DAU/MAU definitions and figures. Checked 2026-11-20.
- Meta Platforms, Fourth Quarter and Full Year 2023 Results: Facebook DAUs and MAUs for December 2023. Checked 2026-11-20.
- Google, User stickiness, Analytics Help: DAU, WAU and MAU windows and the DAU/MAU ratio. Checked 2026-11-20.
Was this article helpful?
We use your answers to fix and expand this page.
Couldn’t send. Please try again in a minute.
Thanks for the feedback. We’ll use it to improve this page.You’ve already sent feedback on this page. Thanks.

Data Analyst
Explores traffic sources, conversion funnels, and retention, using clear metric definitions and concrete examples to explain what the numbers mean.