Try it on your own data
Every report in this article is in the free plan. One snippet for web and apps, up to 10 sites.
Start freeA data analytics platform is the set of components that collects data, stores it, models it into agreed definitions, lets people query and visualize it, and governs access; it can be one product or several tools you connect. The right choice depends on who asks the questions: in our scorecard an all-in-one platform wins for a small team (4.10 against 3.30) and a warehouse wins for a data team (4.10 against 3.60).
What you will learn
- Six layers: collect, ingest, store, model, analyze, govern and activate; decide which you need first and who runs each
- Weight the criteria before demos: with the same scores the ranking flips between a small team and a data team
- Check documented limits in week one: a 1,000,000-events-a-day export cap leaves 30.6% of 1.44 million events out
What is a data analytics platform?
A data analytics platform is the set of components that takes raw data from your products and business systems and turns it into answers people can act on: it collects and ingests the data, stores it, transforms it into a usable shape, lets people query and visualize it, and controls who can see what. It can be one product that does all of that, or several tools you connect. Amazon Web Services' decision guide to analytics describes the same steps from the buyer's side: bringing data in, storing it, processing and transforming it, querying it, visualizing it, and governing who can access it.
So the useful question is not "which platform" but "which layers do I need, and who runs each one?" The next section lists the layers; the sections after it show how to choose between an all-in-one platform and a set of parts, with a scorecard you can recompute. For the product-focused version of the same question, see product analytics platform.
What are the layers of a data analytics platform?
Six layers cover most platforms. Each answers one question, and each has a failure you can test for.
| Layer | What it does | Example inputs or tools | Question to ask |
|---|---|---|---|
| 1. Collect | Captures events and records where they happen | Web script, app SDK, server calls, imported files | Does it capture the events we care about, with a stable visitor ID? |
| 2. Ingest | Moves data to storage, in batches or as a stream | Connectors, queues, log imports | How late can data arrive before it is wrong? |
| 3. Store | Keeps raw and processed data | Warehouse, data lake, the product's own store | How long is raw detail kept, and can we export it? |
| 4. Model | Cleans and joins data into definitions people agree on | SQL transformations, saved metrics, event definitions | Who owns the definition of an "active user" or "conversion"? |
| 5. Analyze | Queries and visualizes | Dashboards, funnels, retention, SQL | Can the people who ask the questions answer them without a ticket? |
| 6. Govern and activate | Controls access, privacy and what leaves the platform | Roles, retention, alerts, exports to other tools | Who can see personal data, and what triggers an action? |
Notice that "activate", sending data out to other tools to act on it, is separate from analysing. It belongs to the customer data platform family; the distinction is in customer data platform. Many teams need layers 1 to 5 first and add the sixth later.
All-in-one platform or separate parts: how do they compare?
Three shapes cover most small and mid-sized teams. The difference is who maintains the layers.
| Shape | Layers covered by the tool | Layers you run | Typical strength | Typical cost |
|---|---|---|---|---|
| All-in-one analytics platform | 1, 2, 3 (its own store), 4, 5 | Few: definitions and access | Fast to first answer; one definition set | Limited joins with outside data |
| Warehouse plus BI tool | 3, 5 (and 4 if modelled in SQL) | 1, 2 and 4: pipelines, schemas, tests | Joins any source; full control | Engineers to build and maintain pipelines |
| Spreadsheet plus free web analytics | 1, 5 (basic) | 2, 3, 4 by hand | Cheapest to start | Manual work; weak on history and identity |
AWS's guide makes the same point: services overlap by design, so choosing is less about finding the one service that can do a job and more about the one that fits how you work. Its four deciding factors are how your teams work (SQL, code or visual tools), how much infrastructure you want to manage (serverless or clusters), how quickly you need results (batch, interactive or streaming), and where your data lives today. The scorecard below turns those factors into numbers.
| Shape | Layers the tool covers | What you run | Strength |
|---|---|---|---|
| All-in-one analytics platform | Collect, ingest, store, model, analyze | Definitions and access | Fast to first answer |
| Warehouse plus BI tool | Store, analyze | Pipelines, schemas, tests | Joins any source |
| Spreadsheet plus free web analytics | Collect, basic analyze | Ingest, store and model by hand | Cheapest to start |
Overlap is by design: choose by team skills, infrastructure to manage, speed needed and where your data lives.
How do you score a platform for your own team?
Weight five criteria, score each shape from 1 (poor) to 5 (strong), and multiply. Sample data: two teams with the same three options, different priorities.
| Criterion | All-in-one | Warehouse plus BI | Spreadsheet plus export | Weight, small team | Weight, data team |
|---|---|---|---|---|---|
| Fits the skills of the people asking questions | 5 | 3 | 4 | 25% | 15% |
| Little infrastructure to manage | 4 | 2 | 5 | 20% | 10% |
| Data freshness (near real time) | 3 | 5 | 1 | 20% | 25% |
| Time to first answer | 5 | 2 | 3 | 20% | 10% |
| Flexibility to join outside data | 3 | 5 | 2 | 15% | 40% |
| Weighted score, small team | 4.10 | 3.30 | 3.10 | ||
| Weighted score, data team | 3.60 | 4.10 | 2.45 |
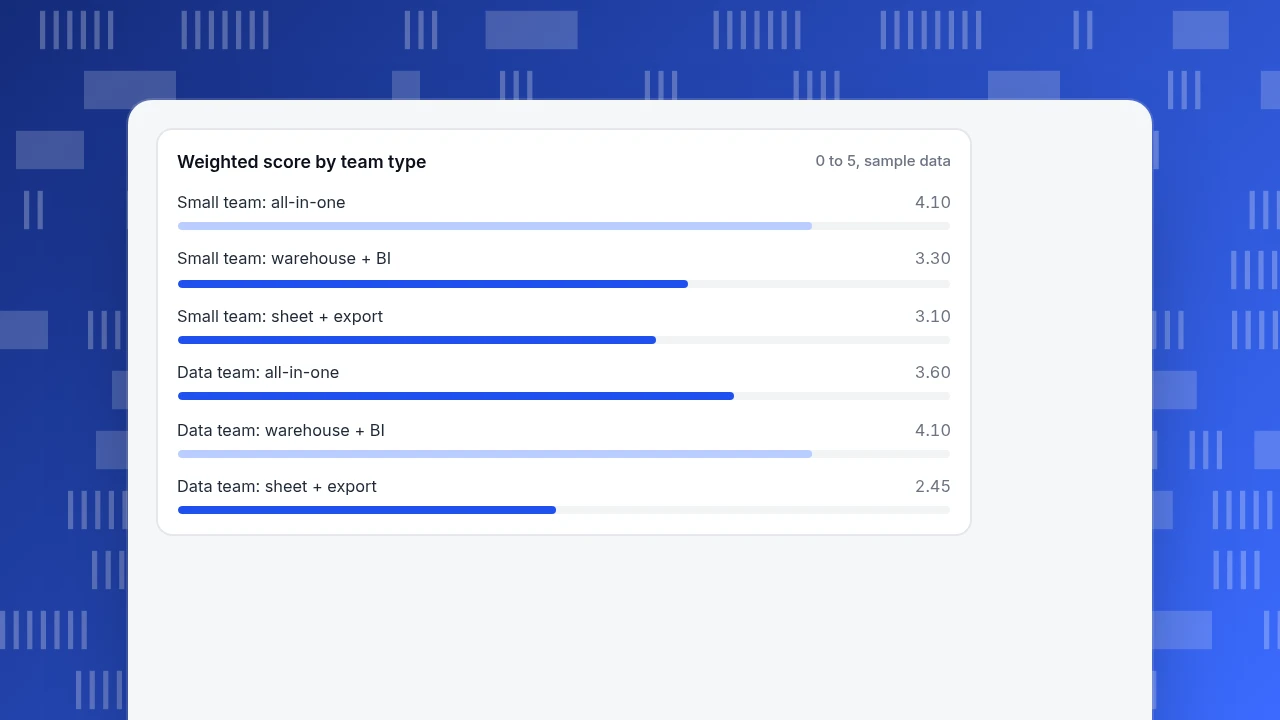
Recompute one cell: all-in-one for the small team is 0.25 × 5 + 0.20 × 4 + 0.20 × 3 + 0.20 × 5 + 0.15 × 3 = 1.25 + 0.80 + 0.60 + 1.00 + 0.45 = 4.10. The point of the table is the ranking flip: with the small team's weights an all-in-one platform wins, 4.10 to 3.30; with the data team's weights, which put 40% on joining outside data, the warehouse wins, 4.10 to 3.60. The scores are judgements, so change them, but write the weights down before you look at vendors; weights chosen after the demo tend to favour the demo.
Weighted score by team type
0 to 5, sample dataWhat limits should you check before you commit?
Check four numbers in the documentation of any tool you shortlist, because each one can quietly break a plan.
- Export caps. Google's analytics help states that standard properties have a daily BigQuery export limit of 1 million events. Past that, filtering is the only way to stay under the cap.
- Retention. The same documentation lets standard properties keep event data for 2 months or 14 months; aggregated standard reports are not affected, but explorations and funnel reports are limited by it.
- Property and parameter limits. For event-based data, the documented limits include 25 event parameters per event, 40 characters for an event name, and 100 characters for most parameter values.
- Raw access. Ask whether you can export row-level data, in what format, and for how long the export file lives.
The worked example below shows how a cap turns into a decision. Sample data: a site with 120,000 visitors a day and 12 tracked events per visitor produces 120,000 × 12 = 1,440,000 events a day. Against a 1,000,000 cap, that is 440,000 events over, so about 30.6% of events would be left out of the export. At 12 events a visitor, the cap supports about 83,333 visitors a day (1,000,000 ÷ 12). Storage grows too: at an assumed 1 KB per event row, 1.44 GB a day is about 43 GB a month, or roughly 518 GB a year, before any transformed copies.
Three outcomes follow from that arithmetic: reduce events per visitor, pay for a higher tier if one exists, or choose a platform that keeps the data and does not cap export. The cap is a fact to find out in week one, not after the migration.
How do you pick one in five steps?
- Write the ten questions the platform must answer, such as "which source brings customers who stay" or "where do trials stall". Questions you cannot write down are not requirements.
- List your sources and where they live. Website, app, billing, support. Note which need joining.
- Set the weights with the people who will use it, using the five criteria above or your own, before you see any demo.
- Run a two-week pilot on real data, answering at least five of the ten questions, and count the minutes and tickets each one took.
- Check the limits and the exit. Read the export, retention and volume limits, and confirm you can get your data out.
If the pilot answers eight of ten questions with no engineer, the all-in-one shape fits; if five of the ten need data from systems the platform cannot read, you need the warehouse shape or an import path.
How does TapCub fit the layers?
Take the all-in-one shape and the ten questions. TapCub covers collection, storage, analysis and part of governance for website, app and mini-program behaviour in one project; it is not a data warehouse, a customer data platform or a tool for sending data out to other tools.
- Collect. Install the script from Web analytics › Configuration › SDK code, or use the iOS, Android, Flutter, React Native, HarmonyOS or mini-program SDKs, or send events from your server over the HTTP interface. The same code serves web, app and mini-program data in one project.
- Ingest. Bring in history through All-platform analytics › Data › Data import: CSV events, CSV user properties and Nginx or Apache logs, up to 100,000 rows per file.
- Model. Agree definitions in All-platform analytics › Data › Events & properties and Tracking plan, and define your own measures under Behavior › Metrics & SQL, where you can also query event data with SQL.
- Analyze. Funnels, retention, paths and goals live in All-platform analytics › Behavior › Behavior analysis; segments in Users › Segments & tags.
- Govern and take out. Set collection level, retention and consent in Configuration › Privacy center, and take raw rows out with an asynchronous export under All-platform analytics › Data › Data export; the exported file is kept for 48 hours. TapCub does not send data on to ad platforms or a CRM.
FAQ
What is a data analytics platform?
A data analytics platform is the combination of components that collect, store, transform, analyze and govern data so people can answer business questions. It may be one product or several tools connected together. The practical test is whether the people asking questions get answers without waiting on engineering.
What are the main components of a data analytics platform?
Collection, ingestion, storage, modelling, analysis (queries and visualization) and governance. In the six-layer table above, each layer has a question to test it; the usual weak points are definitions that nobody owns and export or retention limits discovered late.
What is the difference between a data platform and a data analytics platform?
A data platform stores and manages data for many uses, including applications and machine learning; a data analytics platform focuses on turning data into answers through queries, reports and dashboards. In practice the terms overlap: analytics sits on top of storage and modelling.
How do you choose a data analytics platform?
Write the questions it must answer, weight criteria such as team skills, infrastructure effort, freshness, time to first answer and flexibility, score the options, and pilot on real data for two weeks. Then check the export, retention and volume limits before signing.
Do small businesses need a data analytics platform?
Not always a separate one. A small team often starts with an all-in-one tool that collects and analyses behaviour in one place, then adds a warehouse when it needs to join billing or support data. The scorecard shows the all-in-one shape winning for a small team's weights (4.10 against 3.30).
Sources
- Amazon Web Services. Choosing an AWS analytics service — the steps (bring in, store, process, query, visualize, govern) and four deciding factors. Verified 2026-11-20.
- Google Analytics Help. BigQuery Export — daily export limit of 1 million events for standard properties. Verified 2026-11-20.
- Google Analytics Help. Data retention — 2-month and 14-month event-data retention options. Verified 2026-11-20.
- Google Analytics Help. Collection limits — 25 event parameters, 40-character event names, 100-character parameter values. Verified 2026-11-20.
Was this article helpful?
We use your answers to fix and expand this page.
Couldn’t send. Please try again in a minute.
Thanks for the feedback. We’ll use it to improve this page.You’ve already sent feedback on this page. Thanks.

Data Engineer
Writes about event design, data quality, and collection workflows, with verifiable implementation methods for reliable analytics.