Try it on your own data
Every report in this article is in the free plan. One snippet for web and apps, up to 10 sites.
Start freeA data analysis plan is a one-page statement, written before you see results, of the question, metric, data and period, comparison, segments, test and decision rule. Writing it first stops the choices from drifting toward the answer you hoped for. Below: an eight-line template, filled in for a signup drop (4.0% to 3.2%) and run with real arithmetic.
What you will learn
- Write the question, metric, comparison, segments, threshold and decision rule before opening the data, and log any change with its reason
- Fix the segment list in advance: testing 20 slices at 0.05 gives a 64.2% chance of at least one false alarm
- Attach a decision to every plan; an analysis with no decision rule ends in a chart, not a change
What is a data analysis plan, and why write it before the data?
A data analysis plan is a short written statement, made before you look at the results, of which question you are answering, which numbers you will use, how you will compare them and what you will do depending on the answer. Writing it first matters because once the data is open, every choice (which period, which segment, which test) can be steered toward the answer you hoped for, even unintentionally.
The US Centers for Disease Control and Prevention's evaluation guidance puts the timing plainly: plan data analysis and interpretation "prior to implementation," with an analysis plan that, at a minimum, names the data to analyse, the analysis to perform, when it will happen and who will do it. After the analysis, it asks you to check whether you followed the plan, and to "make note of where you may have deviated from the original plan and why" (CDC). That is the whole discipline in two sentences: decide first, and log departures.
This guide gives a plan template you can fill in on one page, then fills it in for a common question: signups dropped, why? If you are looking for the steps of the analysis itself, see how to analyze data, and for turning the result into a document, data analysis report.
What does a one-page data analysis plan contain?
Eight lines. Each answers one question, and a line left blank is a decision you have not made yet.
| Line | Question it answers | Weak version | Strong version |
|---|---|---|---|
| 1. Question | What are we trying to learn? | "Look at signups" | "Did the signup rate fall after the 3 November release, and for whom?" |
| 2. Decision | What will we do with the answer? | None | "If confirmed and concentrated, assign a fix this sprint" |
| 3. Metric | Exactly what is counted? | "Signups" | "Signups ÷ unique visitors, same time zone" |
| 4. Data and period | Where from and which dates? | "Recent data" | "Analytics, weeks 1–4 versus weeks 5–8" |
| 5. Comparison | Against what? | "Before" | "Four weeks before against four weeks after" |
| 6. Segments | Which splits, decided now? | "Whatever looks interesting" | "Device (mobile, desktop), two splits only" |
| 7. Method and threshold | Which test, what counts as real? | "Looks significant" | "Two-proportion z-test, α = 0.05 split across segments" |
| 8. Decision rule and owner | Who acts, on which result? | "Discuss" | "If mobile alone drops, owner A opens a fix" |
Lines 2 and 8 are the ones people skip, and they are the ones that make the plan useful: an analysis with no decision attached produces a chart, not a change.
Worked example: a filled-in plan for a signup drop
Sample data: signups looked lower after a release on 3 November. Here is the plan, written before opening any segment.
| Line | Entry |
|---|---|
| Question | Did the signup rate fall after the 3 November release, and for whom? |
| Decision | If the drop is real and sits in one device, assign a fix this sprint; if it is spread evenly, check traffic quality first |
| Metric | Signups ÷ unique visitors in the period (the same definition both sides) |
| Data and period | Analytics, weeks 1–4 (before) against weeks 5–8 (after) |
| Comparison | Four weeks before against four weeks after, same weekdays |
| Segments | Device only: mobile and desktop (two splits) |
| Method and threshold | Two-proportion z-test with a pooled estimate; overall α = 0.05, so 0.025 for each of the two segments |
| Decision rule and owner | Mobile only: web owner opens a fix. Both: product lead reviews the flow. Neither: close the item. |
The method line follows the large-sample test in the NIST handbook: with x₁ of n₁ and x₂ of n₂, the pooled proportion is (x₁ + x₂) ÷ (n₁ + n₂) and z is the difference divided by √(p̂(1 − p̂)(1/n₁ + 1/n₂)) (NIST Engineering Statistics Handbook, 7.3.3). The normal approximation applies when the samples are reasonably large, and for small samples NIST recommends Fisher's exact test.
What does the plan show when you run it?
The counts, all sample data:
| Segment | Before: visitors | Before: signups | Before: rate | After: visitors | After: signups | After: rate |
|---|---|---|---|---|---|---|
| Mobile | 13,000 | 468 | 3.60% | 16,000 | 416 | 2.60% |
| Desktop | 18,000 | 772 | 4.29% | 17,000 | 640 | 3.76% |
| All | 31,000 | 1,240 | 4.00% | 33,000 | 1,056 | 3.20% |
Run the planned test, step by step, for the overall comparison. Pooled rate: (1,240 + 1,056) ÷ (31,000 + 33,000) = 3.5875%. Standard error: √(0.035875 × 0.964125 × (1/31,000 + 1/33,000)) = 0.1471 percentage points. Difference: 4.00% − 3.20% = 0.80 points. So z = 0.80 ÷ 0.1471 = 5.44, and the two-sided p-value is about 5 × 10⁻⁸. The overall drop is real, and large in relative terms: 20.0% fewer signups per visitor.
Then the pre-specified segments, each against the 0.025 threshold:
- Mobile: 3.60% to 2.60%, z = 4.93, p ≈ 8 × 10⁻⁷. Significant.
- Desktop: 4.29% to 3.76%, z = 2.49, p ≈ 0.013. Significant at 0.025.
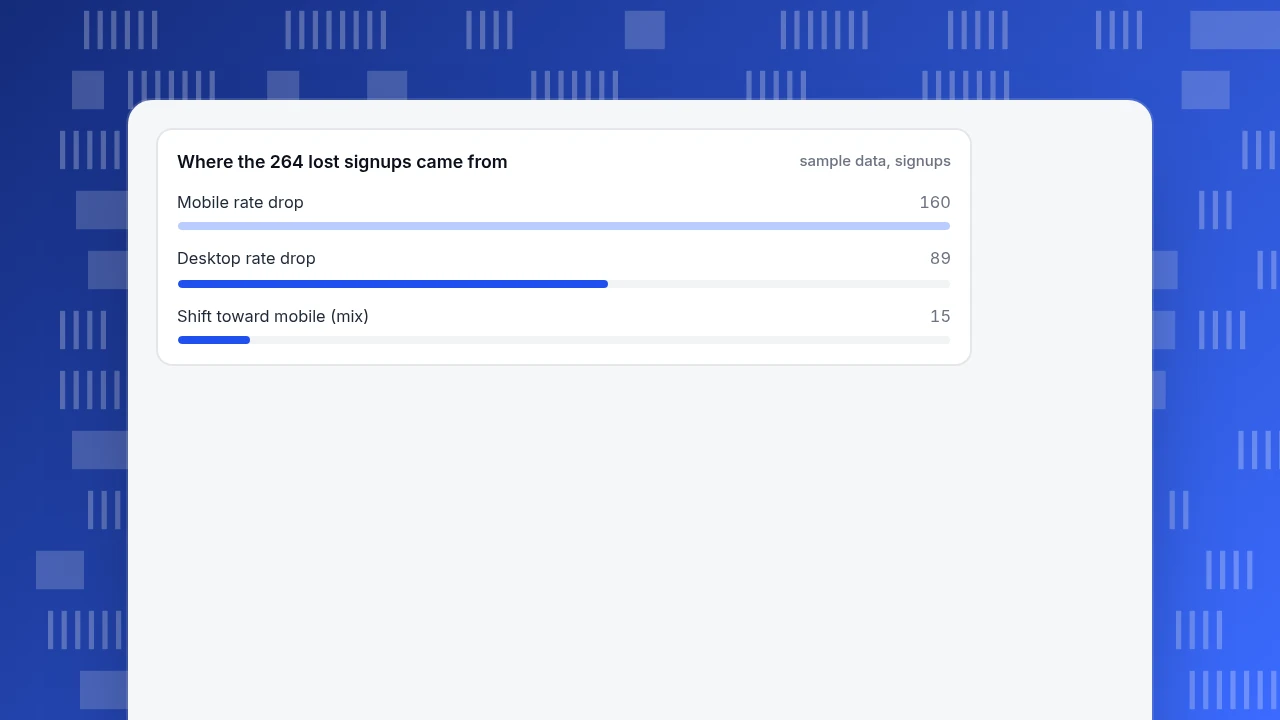
One more check the plan did not list but a careful analyst adds: mix. Mobile's share of visitors rose from 41.9% to 48.5%, and mobile converts worse, so part of the drop is composition. Splitting the 0.80-point fall: the rate effect (each segment's rate change at the after-mix) is −0.755 points and the mix effect is −0.045 points, which add to −0.80. In signups: mobile lost 160 (1.00 point × 16,000), desktop lost 89 (0.52 point × 17,000), and mix accounts for about 15, a total of 264 = 0.80 points × 33,000. The decision rule says both devices dropped, so the product lead reviews the flow, with mobile first because it lost almost twice as many signups.
Where the 264 lost signups came from
sample data, signupsWhy choose the segments before looking?
Every extra slice is another chance for noise to look like a finding. If you test k independent slices at α = 0.05, the chance that at least one shows a "significant" difference by luck alone is 1 − 0.95^k:
| Slices tested | Chance of at least one false alarm |
|---|---|
| 1 | 5.0% |
| 5 | 22.6% |
| 10 | 40.1% |
| 20 | 64.2% |
The simplest correction is Bonferroni: divide α by the number of comparisons in the family. NCES's technical documentation gives the same arithmetic, α = 0.05 ÷ 4 = 0.0125 for four comparisons, and notes that the critical value rises from 1.960 to 2.498 as the family goes from one comparison to four, a 27.4% increase (NCES). In the example, desktop's p of 0.013 passes the plan's 0.025 threshold. Had you sliced four ways after the fact, it would have missed the 0.0125 threshold. Same data, different conclusion: this is why the segment list is written first.
| Slices tested at α = 0.05 | Chance of at least one false alarm | Bonferroni threshold per slice |
|---|---|---|
| 1 | 5.0% | 0.0500 |
| 5 | 22.6% | 0.0100 |
| 10 | 40.1% | 0.0050 |
| 20 | 64.2% | 0.0025 |
False-alarm chance = 1 − 0.95^k for k independent slices; the threshold is α ÷ k, the Bonferroni procedure described by NCES (checked 2026-11-20).
How much data is enough?
A plan should say the smallest change worth acting on, and the sample that could detect it. With the standard two-proportion approximation, at α = 0.05 and 80% power, detecting a fall from 4.0% to 3.2% needs about 8,511 visitors per period. The example has 31,000 and 33,000, so it is well covered. Detecting a fall from 4.0% to 3.6% needs about 35,864 per period, more than either period had, so a drop that small would not have been reliably detected. Write the smallest change you would act on into line 7; if the data cannot detect it, extend the period before you start rather than after.
What do you do when the plan and the data disagree?
Three situations come up, and the plan should have a line for each:
- The result clearly matches a decision-rule branch. Act on it. Done.
- Something unplanned looks interesting. Label it exploratory, write it down separately and do not claim significance. Plan a follow-up test with its own threshold.
- You must change the plan. Change it in writing before the analysis, say why, and tell the people who will use the result. The CDC checklist asks for exactly this: note the deviation and its reason and share the change before analysis begins.
Common mistakes in data analysis plans
- No decision attached. A plan without a decision rule ends in a discussion, not an action.
- Metric defined twice. "Signup rate" using visitors in one week and sessions in the next produces a fake drop.
- Comparing unlike periods. A holiday week against an ordinary week is not a before and after.
- Slicing after the fact. See the false-alarm table.
- Ignoring mix. A segment shift can look like a rate change, as the 15-signup mix effect shows.
How to run this plan in TapCub
The example above uses counts that TapCub provides directly. The test itself is a few spreadsheet cells from the formula above.
- Confirm the event is arriving. Under All-platform analytics › Data › Tracking plan, check that the signup event is listed and, with real-time validation on, that its recent arrivals and required properties look complete. A broken event looks like a drop.
- Build the funnel twice. In All-platform analytics › Behavior › Behavior analysis, build the signup funnel for weeks 1–4 and again for weeks 5–8, one period at a time, and put the two results side by side. Each run gives people per step and step conversion.
- Split by device. Add a device filter to each run to get the mobile and desktop counts for your table.
- Mark the release. Add an annotation for 3 November under Configuration › Annotations, so anyone reading the trend sees the date the plan is anchored to.
- Use the AI assistant for the exploratory part. In All-platform analytics › Operations › AI Assistant, ask what changed; its change attribution breaks a change down by channel, source domain, country, device and landing page. Treat what it finds as exploratory unless it was in your plan.
- Watch it going forward. Create a monitor for the signup rate under All-platform analytics › Operations › Monitors; a trial run tells you how often it would have fired over the last 30 days.
TapCub does not write the plan, choose the test or decide what is significant; the plan is yours, and TapCub provides the counts, the split and the marker.
FAQ
What is a data analysis plan?
It is a written statement, made before you look at results, of the question, the metric, the data and period, the comparison, the segments, the test and threshold, and what you will do for each outcome. The CDC advises planning analysis before implementation and noting any deviations afterwards.
What should a data analysis plan include?
At minimum: the data to analyse, the analysis to perform, when it will be done and who will do it, as the CDC checklist states. In practice add the metric definition, the segments, the threshold and the decision rule.
How is a data analysis plan different from a data analysis report?
The plan is written before the analysis and says how you will decide; the report is written after and says what you found. Comparing the two shows whether you changed course, which is the point of the plan.
How many segments should I plan to compare?
As few as the decision needs. If you test k independent slices at 0.05, the chance of at least one false alarm is 1 − 0.95^k: 22.6% for 5 and 64.2% for 20. Divide α by the number of slices if you test several.
How much data do I need to detect a signup drop?
For a fall from 4.0% to 3.2% at α = 0.05 and 80% power, about 8,511 visitors per period; for a fall from 4.0% to 3.6%, about 35,864. Smaller changes need much more data.
Sources
- US Centers for Disease Control and Prevention, "Step 5 Checklist" (evaluation framework action guide): plan analysis before implementation, minimum contents, note deviations. https://cdc.gov/evaluation/php/evaluation-framework-action-guide/step-5-checklist.html (checked 2026-11-20)
- NIST/SEMATECH e-Handbook of Statistical Methods, section 7.3.3, comparing two proportions: pooled estimate, z statistic, large-sample condition, Fisher's exact test for small samples. https://www.itl.nist.gov/div898/handbook/prc/section3/prc33.htm (checked 2026-11-20)
- National Center for Education Statistics, "Bonferroni procedure": α divided by family size, 0.0125 for four comparisons, critical value 1.960 to 2.498. https://nces.ed.gov/nationsreportcard/tdw/analysis/2000_2001/infer_multiplecompare_bonfer.aspx (checked 2026-11-20)
Was this article helpful?
We use your answers to fix and expand this page.
Couldn’t send. Please try again in a minute.
Thanks for the feedback. We’ll use it to improve this page.You’ve already sent feedback on this page. Thanks.

Data Engineer
Writes about event design, data quality, and collection workflows, with verifiable implementation methods for reliable analytics.