Try it on your own data
Every report in this article is in the free plan. One snippet for web and apps, up to 10 sites.
Start freeGood dashboard design gives one audience one question, fits it on one screen, orders tiles by decision priority and attaches a comparison to every number. A sample cluttered dashboard of 14 tiles is redesigned to 6 below, with a chart-choice table, computed contrast ratios and a test for what to leave off.
What you will learn
- Design from one question: tiles that would not change anyone's action if the number changed do not belong on the board
- Choose charts by question: sorted bars and lines for comparison and change, a funnel for drop-off, numbers with a change instead of gauges
- Check contrast with numbers (4.5:1 for text, 3:1 for chart parts) and never use red and green alone for status
What makes a dashboard design work?
A dashboard works when one named person can answer one named question from it in under a minute. Stephen Few's often-quoted definition makes the same point: a dashboard is "a visual display of the most important information needed to achieve one or more objectives," consolidated and arranged "on a single screen so the information can be monitored at a glance" (Few, Dashboard Confusion). Four rules follow from that definition, and the rest of this guide applies them:
- One audience, one question. "Are weekly signups on track, and if not, where is the drop?" is a question. "Marketing performance" is a topic.
- One screen. If it scrolls, the bottom half is a report, not a dashboard. Put the report behind a link.
- Reading order matches decision order. The number that triggers action goes top left; the explanation sits below it.
- Every number carries a comparison. A bare 4,210 means nothing. 4,210 against last week's 4,890 does.
For the content side of the same problem (which KPIs to put on a board for an executive audience), see analytics dashboard and KPI dashboard. This guide is about layout, chart choice and what to leave off.
What does a cluttered dashboard look like?
Sample data: a growth team's weekly dashboard has grown for a year. It answers the question "are signups on track?" for a manager who opens it every Monday. It holds 14 tiles on two screens:
| Tile type | Count | What is wrong |
|---|---|---|
| Single numbers with no comparison | 5 | 4,210 signups is neither good nor bad without a target or a previous week |
| Pie charts | 3 | One has nine slices; the two largest are 24% and 22% |
| Gauges | 2 | A needle takes space and shows one value a number would show better |
| Line charts | 2 | One has six lines in similar colours |
| Table of every page | 1 | 40 rows; nobody scans them every Monday |
| Map | 1 | Decorative; no decision depends on it |
The manager still cannot answer the question in a minute. Nothing is wrong with the data. The layout has no hierarchy, so every tile claims the same attention.
Which chart answers which question?
Match the chart to the question, not to what looks interesting. The reasoning comes from graphical perception research: in Cleveland and McGill's classic experiments, people judged values most accurately by position along a common scale, and less accurately by length, angle and area, and crowdsourced replications by Heer and Bostock found a broadly similar ordering (Heer and Bostock, CHI 2010). Pie slices rely on angle and area, which is why they are the weakest choice when readers must compare close values.
| Question | Use | Avoid | Why |
|---|---|---|---|
| Which channel is biggest? | Horizontal bars sorted by value | Pie with more than 3 slices | Position on a common scale is the easiest to read |
| How did this change over time? | Line with at most 3 series | Six lines in similar colours | Readers must trace a line back to a legend |
| What share is each part? (2 or 3 parts) | One stacked bar or two numbers with percentages | Gauge | A number states the value without a needle |
| Where do people drop out? | Funnel with step rates | Table of counts only | The step rate shows where to look |
| What is the exact value? | Small table of at most 10 rows | Table of 40 rows | A long table is a report, not a dashboard |
| Is this one number on target? | Number with change vs last period | Speedometer gauge | The comparison is the information |
Take the pie from the cluttered dashboard and keep only its five biggest channels. Shares of 24%, 22%, 20%, 18% and 16% give slice angles of 86.4°, 79.2°, 72.0°, 64.8° and 57.6°. Telling the first two apart means seeing a 7.2° difference (2 points × 3.6°). As sorted bars on a 0–30% scale, the same two points are a visible step. The data has not changed; only the reading has become easier.
| Question | Use | Avoid |
|---|---|---|
| Which channel is biggest? | Horizontal bars sorted by value | Pie with more than 3 slices |
| How did it change over time? | Line with at most 3 series | Six similar-colour lines |
| Is this number on target? | Number with change vs last period | Speedometer gauge |
Position on a common scale is judged more accurately than angle or area (Cleveland and McGill; replicated by Heer and Bostock, CHI 2010).
How would the redesigned dashboard look?
The redesign starts from the question and works down. Six tiles replace the fourteen, in reading order:
- Signups this week against last week and against target (one number, change in points, status label). It answers the question at a glance.
- Signup rate over the last 12 weeks (one line, one annotation for the release). It shows whether this week is an outlier.
- Signup funnel with step rates (visit, start, finish). It shows where the drop is.
- Signup rate by device and by source, as sorted bars. It shows who dropped.
- Open alerts (a short list with a link). It shows whether something broke.
- A text note with the definition of "signup" and the date range. It prevents arguments.
That is 6 tiles instead of 14, a 57.1% reduction, and it fits on one screen. The 40-row page table, the map, the gauges and the second pie moved behind a link labelled "full report." Nothing was deleted; it was moved to where it is read on purpose rather than scanned by accident.
How do you check contrast and colour?
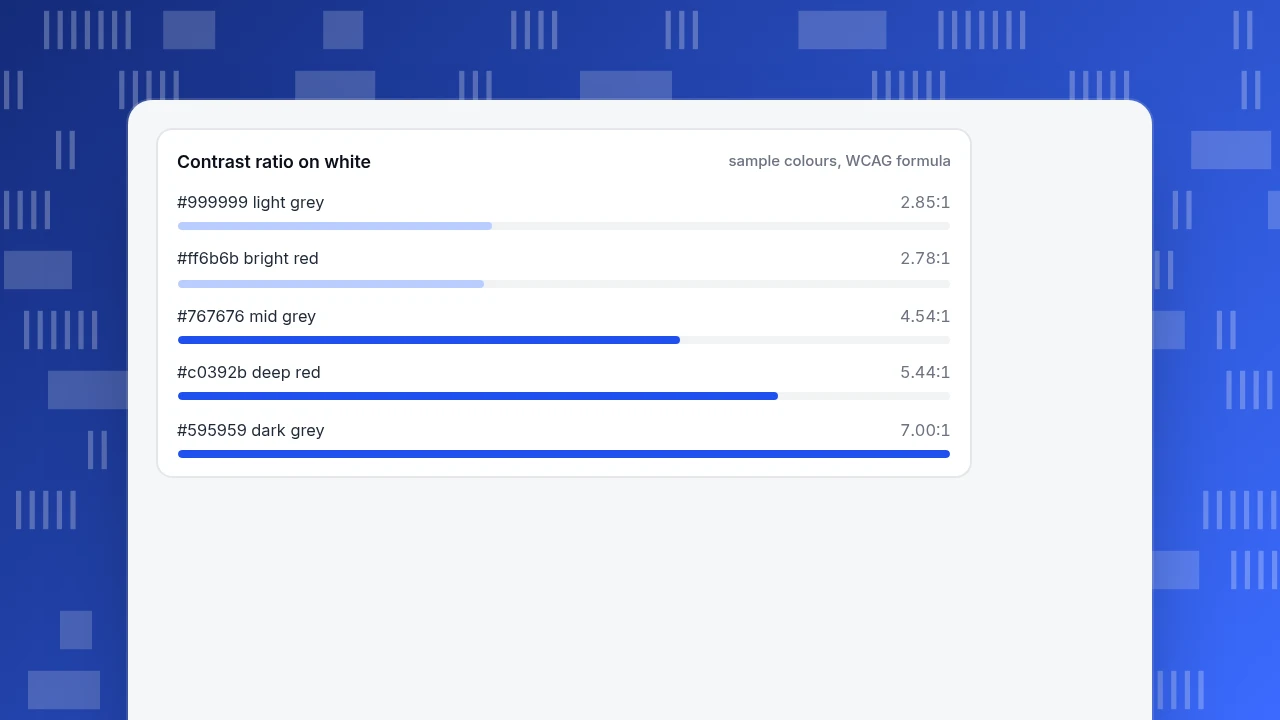
Colour carries meaning on a dashboard (good, bad, selected), so it must survive poor screens and colour-vision differences. The Web Content Accessibility Guidelines set the thresholds: text needs a contrast ratio of at least 4.5:1, large text 3:1 (W3C WCAG 2.2, 1.4.3), and the parts of a chart needed to understand it, such as lines, need at least 3:1 against adjacent colours (W3C WCAG 2.2, 1.4.11). The ratios below are calculated with the WCAG formula against a white background:
| Colour | Contrast on white | Passes 4.5:1 text | Passes 3:1 line |
|---|---|---|---|
| #999999 (light grey text) | 2.85:1 | No | No |
| #767676 (mid grey) | 4.54:1 | Yes | Yes |
| #595959 (dark grey) | 7.00:1 | Yes | Yes |
| #ff6b6b (bright red) | 2.78:1 | No | No |
| #c0392b (deep red) | 5.44:1 | Yes | Yes |
The light grey labels and the bright-red "down" arrows that were common on the cluttered board both fail. About 1 in 12 men have colour vision deficiency, and the most common type makes red and green hard to tell apart (National Eye Institute). So never use red and green alone for status: add an icon or a word (Up, Down, On target) to every coloured number.
Contrast ratio on white
sample colours, WCAG formulaWhat should you leave off a dashboard?
Ask one question of every tile: if this number changed tomorrow, what would someone do differently? If the answer is "nothing", the tile does not belong on the board.
| Tile | Typical reason it was added | Verdict |
|---|---|---|
| Lifetime totals | Looks impressive | Remove: grows every day and never triggers action |
| Nine-slice pie | Shows "everything" | Replace with sorted bars of the top five |
| Gauges | Familiar from cars | Replace with a number and a change |
| Decorative map | Looks good in a demo | Move behind a link unless region drives decisions |
| 40-row table | Completeness | Move to a report page |
| Twelve KPIs in a row | Fear of leaving one out | Keep the three tied to the question |
A useful limit: if you cannot explain the dashboard's purpose in one sentence, you have a collection, not a dashboard.
How do you test a dashboard in five minutes?
- Question test. Ask a colleague who has not seen it the board's question. They should answer within a minute without help.
- Five-second test. Show the board for five seconds, then hide it and ask what the biggest problem was. If answers differ, the hierarchy is wrong.
- Comparison test. Point at each number and ask "compared with what?" Every one must have an answer on the screen.
- Contrast test. Check every text and line colour against the ratios above.
- Small-screen test. Open it on a laptop and on a phone. If the first tile is not the answer on both, reorder.
Run it again whenever a tile is added. Boards grow by one reasonable tile at a time, and the cluttered example above took a year to happen.
How to build the redesigned board in TapCub
The six-tile board above maps directly onto TapCub's dashboards. A card on a board is a saved analysis, a text block or a divider.
- Save each analysis. In All-platform analytics › Behavior › Behavior analysis, build the signup funnel and the rate trend, then save each one with a name and a description.
- Create the board. Open All-platform analytics › Overview › My dashboards, add the saved analyses as cards in reading order, and use a text block for the definition note and a divider to separate the breakdowns.
- Set the board's own date range. The board has its own date, filters and identity; leave the identity alone and each card keeps its own.
- Make it the default and pin it. A board can be the default board, and it can be pinned into the web, app or mini-program sidebar, where it filters to that platform.
- Add the alert list and the release marker. Create a monitor for the signup rate in All-platform analytics › Operations › Monitors, and mark the release under Configuration › Annotations so the trend line shows when the change happened.
- Share read-only when needed. A dashboard share is a read-only link, the password may be left empty, and shared boards show at most the last 90 days.
TapCub does not decide which questions matter or which tiles to drop; those choices come from the tests above, and TapCub puts the result on one board.
FAQ
What are the principles of good dashboard design?
Give each dashboard one audience and one question, fit it on one screen, order tiles by decision priority, and pair every number with a comparison. Use sorted bars and lines instead of pies and gauges, and check that colours pass contrast thresholds.
How many charts should a dashboard have?
There is no fixed number, but the number should be small enough to fit on a single screen and each chart should answer part of the one question. In the worked example, six tiles replaced fourteen.
Which chart should I use for a dashboard?
Use sorted horizontal bars to compare categories, a line for change over time (at most three series), a funnel with step rates for drop-off, and a number with a change for one metric against a target. Avoid pies with more than three slices and gauges.
How do I make a dashboard accessible?
Use text contrast of at least 4.5:1 and lines or chart parts of at least 3:1, as WCAG sets out, and never rely on red and green alone: about 1 in 12 men have colour vision deficiency. Add words or icons to status colours.
What should I not put on a dashboard?
Anything that would not change what someone does if it changed: lifetime totals, decorative maps, gauges, long tables and numbers with no comparison. Put detail behind a "full report" link.
Sources
- Stephen Few, "Dashboard Confusion" (Information Management): the definition of a dashboard and the single-screen requirement. https://www.informationweek.com/government/dashboard-confusion-2 (checked 2026-11-20)
- W3C, WCAG 2.2 Understanding 1.4.3 Contrast (Minimum): 4.5:1 for text, 3:1 for large text. https://www.w3.org/WAI/WCAG22/Understanding/contrast-minimum.html (checked 2026-11-20)
- W3C, WCAG 2.2 Understanding 1.4.11 Non-text Contrast: 3:1 for graphical objects. https://www.w3.org/WAI/WCAG22/Understanding/non-text-contrast.html (checked 2026-11-20)
- National Eye Institute, "Color blindness": about 1 in 12 men have colour vision deficiency. https://www.nei.nih.gov/learn-about-eye-health/eye-conditions-and-diseases/color-blindness (checked 2026-11-20)
- Heer and Bostock, "Crowdsourcing Graphical Perception", CHI 2010: crowdsourced replication of Cleveland and McGill's encoding ordering. https://idl.uw.edu/papers/crowdsourcing-graphical-perception (checked 2026-11-20)
Was this article helpful?
We use your answers to fix and expand this page.
Couldn’t send. Please try again in a minute.
Thanks for the feedback. We’ll use it to improve this page.You’ve already sent feedback on this page. Thanks.

Customer Experience Consultant
Writes about live chat, visitor conversations, and self-service, sharing practical ways to make customer communication clearer and more effective.