Try it on your own data
Every report in this article is in the free plan. One snippet for web and apps, up to 10 sites.
Start freeA data discrepancy is a gap between two numbers that should match, and it is usually not an error: it comes from different session definitions, a different time zone for the day, bots filtered in one place, blocked visitors, sampling or attribution. Measure it as (B − A) ÷ A, set a tolerance first, then check causes in order.
What you will learn
- Compute the gap as (B − A) ÷ A against one reference tool, and set your tolerance before you look
- Change one setting at a time (bots, session timeout, time zone) and record how much of the gap each closes
- Compare conversions and revenue against the store's own orders, not against another platform's claims
What counts as a data discrepancy, and when does it matter?
A data discrepancy is a gap between two numbers that are supposed to measure the same thing: sessions in two analytics tools, orders in your store versus orders in your ad platform, clicks in a report versus visits on your site. A gap is not automatically an error. It becomes a problem when you cannot explain it, or when it is large, sudden or growing.
Measure it the same way every time:
Discrepancy % = (Tool B − Tool A) ÷ Tool A × 100
Pick one tool as Tool A, the reference for that question, and always divide by it. If A reports 10,000 sessions and B reports 11,150, the discrepancy is 1,150 ÷ 10,000 = 11.5%. Writing the formula down matters because "about 10% off" means different things when each side divides by its own number.
Decide your tolerance before you start, not after you see the gap. A team might say "under 5% on sessions is fine, over 10% needs an explanation" (that is a working rule you set, not an industry standard). The point is that the tolerance exists, so a gap does not turn into an argument.
Most gaps come from definitions, not bugs. The rest of this guide goes through the eight usual causes, a worked reconciliation you can copy, and a checklist that finds the cause in the order it is most likely to be. Two tools reporting different unique-visitor counts has its own page, why UV never matches; this one is the general method.
The eight usual causes
Check them in roughly this order. The first four explain most day-to-day gaps between two web analytics tools.
| # | Cause | What differs | Quick check |
|---|---|---|---|
| 1 | Metric definitions | What counts as a session, a visitor, a conversion | Read both definitions; compare the session timeout |
| 2 | Day boundary | Time zone each tool cuts the day in | Compare one hour, not one day, in the same zone |
| 3 | Bots | Whether crawlers are filtered, and with which list | Compare human-only traffic on both sides |
| 4 | Blocking and consent | Which visitors the tool can see at all | Compare against server logs or order counts |
| 5 | Sampling and modeling | Whether the number is measured, estimated or sampled | Look for a "based on N%" or "modeled" label |
| 6 | Attribution and conversion timing | Which touch gets the sale; conversion date vs click date | Match the model and window first |
| 7 | Implementation | Tags that fire twice, never fire, or are filtered | Test three fixed pages in a private window |
| 8 | Processing delay | Data that has not finished arriving | Re-run the comparison for a day that is at least 2 days old |
Cause 1: the two tools define "session" differently
A session is a group of visits cut by a rule, and the rule is a choice. Google Analytics 4 ends a session after 30 minutes of inactivity by default and lets you set the timeout anywhere up to 7 hours 55 minutes; another tool can use 15 minutes, 30 minutes or a daily cut-off.
Here is what that does. One visitor loads pages at minute 0, minute 20 and minute 45:
- Gaps: 20 minutes, then 25 minutes.
- With a 30-minute timeout, neither gap is long enough to end the session: 1 session.
- With a 15-minute timeout, both gaps are longer: 3 sessions.
Same visitor, same pages, a 3-to-1 difference. Across a site where people keep a tab open and come back, a shorter timeout can inflate sessions by double digits while visitors and pageviews stay close.
Visitors have the same problem. "Unique visitor" depends on how a person is recognized: a first-party cookie, a device ID, a login ID, or a hash of network and browser. One person with a laptop and a phone is two visitors in one tool and one person in another. Conversions are worse: a "conversion" may be a goal, a key event, an order or a form submit, counted once per session in one tool and once per person in another.
Rule: before comparing numbers, write the definition of the metric for each tool in one line. If the lines differ, you have found the gap and there is nothing to fix.
Cause 2: the day boundary sits in a different place
A "day" is midnight to midnight in some time zone. If one tool cuts days in UTC and the other in your store's zone, evening traffic lands on different days.
A concrete case: your store runs on Pacific Standard Time (UTC−8). UTC midnight is 4:00 pm Pacific. Everything from 4:00 pm to midnight Pacific, usually the busiest part of a US retail day, belongs to tomorrow in a UTC report and to today in a local one. Compare a single day and the two tools can differ by tens of percent; compare a full week and the shifted evenings mostly cancel out at the edges.
How to check: pick one full day, convert the boundaries to the same zone, and compare again. Monthly totals near the 1st have the same problem, and so do monthly plan quotas that reset at midnight in a particular zone.
Cause 3: bots are counted in one place and filtered in the other
Crawlers, uptime monitors and AI scrapers produce real requests. A tool that filters them will report fewer visits than one that does not, and the difference can be a fixed share of traffic or an occasional spike. Google Analytics, for example, automatically excludes known bots and spiders using its own research and the IAB's International Spiders and Bots List; the exclusion cannot be turned off and the amount removed is not shown. Another tool can use a different list, or filter nothing.
Check: in each tool, look at traffic that is clearly human, such as visits that reached a checkout page, and compare only that. If the gap shrinks sharply, bots were the main cause. Bots that behave like browsers are the hard part; which crawlers show up and how they are identified is covered in Googlebot, GPTBot and the glossary entry on bot filtering.
Cause 4: some visitors are invisible to one tool
Browser-based tools cannot count a visitor whose browser blocks the script, who declined consent, or who sends Do Not Track or Global Privacy Control signals that the tool honors. Server-side sources, such as your web server log or your order database, see everyone who reached the server.
This is why a tag-based analytics number is usually lower than a server log, and why an order count in your store is the number to trust for "how many orders". Two tags can therefore disagree simply because one waits for consent and the other does not, and both will read lower than a server log that also counts crawlers.
Check: compare against something that does not run in the browser. If analytics says 5,200 orders and the store database says 5,350, the 150 missing orders (2.8%) are visitors the tag never saw or purchases it did not record.
Causes 5 and 6: sampling, modeling and attribution
Sampling and modeling. Some reports are computed from a subset of data, and some figures are estimated to fill gaps. A sampled report usually shows a label such as "based on N% of sessions". When one tool shows measured data and the other shows a sample or a modeled estimate, small differences are expected; large ones on a narrow segment are common. See data sampling for how to detect it and how large the error can be.
Attribution and conversion timing. Ad platforms and analytics tools answer different questions. An ad platform credits a conversion to its own ad, often counting view-through conversions and reporting by the date of the click, not of the purchase. Your analytics tool credits the visit that led to the purchase, using its own attribution model and lookback window. Two platforms that each take credit for the same $60 order will add up to more than your store revenue. The fix is to pick one source of truth for revenue (the store) and compare platform claims against it; see what attribution is for the models and the web analytics audit for a full tracking check.
Causes 7 and 8: implementation errors and processing delay
Implementation. The usual faults: the tag is missing on some templates (checkout on a separate domain is the classic case); the tag fires twice on a single-page app route change; internal traffic is filtered in one tool and not the other; query strings are treated as separate pages in one and merged in the other; a staging site is counted by mistake. Test three fixed pages in a private window, stay on each for more than a few seconds, and confirm the live report shows exactly three pageviews and one visitor.
Processing delay. Reports finish arriving after the day ends. Search-console style data is commonly a day or two behind, ad platforms backfill conversions for days after the click, and some analytics tools process in batches. A comparison made on today's partial data will always differ. Compare days that are at least two days old; the idea is explained in data latency.
A worked reconciliation you can copy
Sample data: Tool A (your analytics, the reference) reports 10,000 sessions on a day. Tool B (a second tool) reports 11,150. The discrepancy is 1,150 ÷ 10,000 = 11.5%. Work down the list and measure each cause by changing one setting at a time:
| Step | Change made | Sessions in B after the change | Gap closed |
|---|---|---|---|
| Start | Nothing | 11,150 | 0 |
| 1 | Exclude bots in B using the same rule as A | 10,730 | 420 |
| 2 | Set B's session timeout to A's value (30 minutes) | 10,420 | 310 |
| 3 | Cut B's day in A's time zone | 10,160 | 260 |
| Remaining | Unexplained | 10,160 vs 10,000 | 160 |
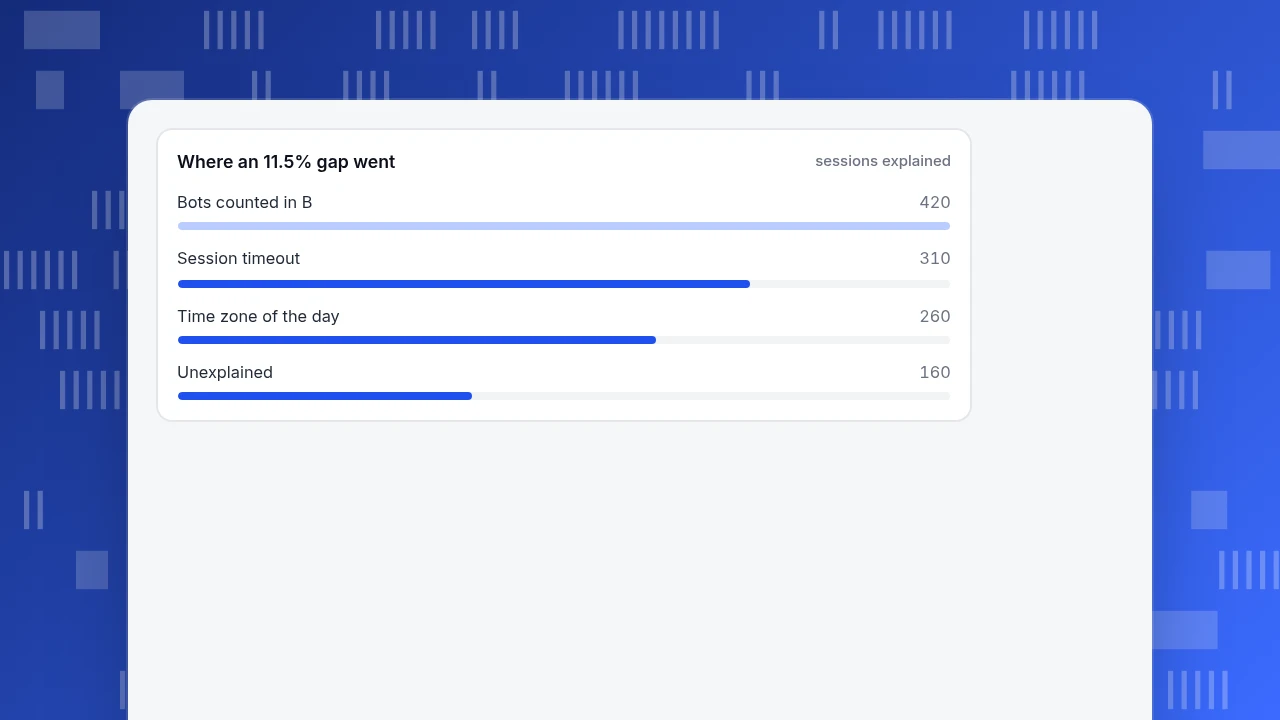
Bots explain 420 ÷ 1,150 = 36.5% of the gap, the timeout 310 ÷ 1,150 = 27.0%, the time zone 260 ÷ 1,150 = 22.6%, and 160 sessions, or 1.6% of A's total, remain unexplained. (420 + 310 + 260 + 160 = 1,150.) An 11.5% gap became a 1.6% gap without touching any tracking code. Whether 1.6% is acceptable is the tolerance decision from the first section.
Note the order: you can change the steps' order and the individual numbers shift a little, because causes overlap, but the total explained stays the same. Record the order you used.
Where an 11.5% gap went
sessions explainedA checklist for finding the cause in order
- Write the question. "How many sessions on Tuesday?" Not "why is analytics wrong?"
- Pick the source of truth for that question: orders from the store database, sessions from your main analytics tool.
- Compute the discrepancy % with the formula above, using the reference tool as the divisor.
- Align the day. Same zone, a full day, at least two days old.
- Align the definition. Session timeout, visitor identity, what counts as a conversion.
- Align the audience. Humans only; internal traffic excluded on both sides.
- Check the tag. Three fixed pages, private window, one pageview each.
- Check for sampling or modeling labels in both reports.
- Only then look at attribution differences, if the numbers are conversions or revenue.
- Write down what is left and decide: within tolerance, or investigate.
| Symptom | Most likely cause | First check |
|---|---|---|
| Sessions much higher in one tool, visitors close | Session timeout differs | Compare the timeout; test a visit at 0, 20 and 45 minutes |
| Daily totals differ, weekly totals close | Day boundary in a different time zone | Compare one hour in the same zone |
| One tool higher by a roughly fixed share | Bots counted in one tool | Compare human-only traffic, such as visits that reached checkout |
| Analytics orders below store orders | Blocking, consent or a missing tag | Compare against the store database; test checkout |
| Ad platform conversions above store orders | Overlapping attribution, view-through, click-date reporting | Compare each platform against store revenue |
| Gap disappears tomorrow | Processing delay or partial day | Compare days at least two days old |
Work from the top: the first rows explain most day-to-day gaps between web analytics tools.
Common mistakes
- Trying to force two tools to match. They measure with different rules, so an exact match is not the goal. A stable, explained gap is.
- Comparing the wrong pair. An ad platform's conversions against analytics sessions are different things; compare each against revenue in your store.
- Fixing before explaining. Changing a tag to close a gap you have not diagnosed adds a new difference.
- Comparing today. Partial days and delayed data produce gaps that vanish tomorrow.
- Judging with a single day. A one-day gap that is 11.5% might be 3% over a month because the evening shift averages out. Look at the trend, not one point.
- Trusting the bigger number. Bigger is not better. If bots inflate one tool, the larger count is the wrong one.
How to reconcile numbers in TapCub
Suppose the example above: TapCub says 10,000 sessions and another tool says 11,150. In TapCub's own settings you can see and change most of the causes yourself:
- Open Configuration › Settings › General and read Time zone. TapCub cuts every daily, weekly and monthly report in the project time zone, not your browser's or UTC midnight, so set the other tool to the same zone before comparing a day.
- Open Web analytics › Bots. New projects count recognized bots and AI crawlers separately, so human reports exclude them; compare TapCub's human traffic with the other tool's human traffic, and use the All bots tab to see how large the crawler share is.
- Check the session rule. TapCub's default is 30 minutes idle and 24 hours maximum, and the rule can be changed in the project's session rules (idle from 5 to 720 minutes). Rule changes apply only to data collected afterwards, so compare days after the change.
- Remember how a visitor is recognized: TapCub's script writes no cookie and no local storage; the visitor ID is derived on the server from IP and browser, so a new network or browser is a new visitor, and browsers sending Do Not Track or Global Privacy Control do not run the script by default. A cookie-based tool will look more stable for the same people.
- To check a total, open Web analytics › Sessions and sample a few real visits, then match the same visits against the other tool. A session that runs past midnight counts once on the day it started in the overview, while the sessions list shows it on both days.
TapCub does not reconcile two tools for you or alter another tool's numbers; it exposes its own definitions so that you can match them.
FAQ
Why do my analytics numbers not match?
Different tools apply different rules: how a session is cut, which time zone starts a day, whether bots are filtered, who is visible given blocking and consent, and whether a figure is measured or estimated. Align the definition, day and audience first, then look at tags and attribution.
What is an acceptable discrepancy between analytics tools?
No standard figure exists; it depends on the question and the cost of being wrong. Many teams set a working tolerance, such as 5% on sessions, then investigate anything above it. Whatever you pick, write it down and apply it the same way each time.
Which analytics tool should I trust?
Trust the source closest to the event for each question: orders from your store database, ad spend from the ad platform's invoice, sessions from the one analytics tool you use for decisions. Use the others to detect drift, not to overrule it.
How do I calculate the discrepancy between two numbers?
Subtract the reference value from the other value, divide by the reference value, and multiply by 100. For 10,000 versus 11,150: (11,150 − 10,000) ÷ 10,000 = 11.5%. Always divide by the same reference tool.
Why does the ad platform show more conversions than my analytics tool?
Ad platforms credit their own ads and may count view-through conversions and report by click date, while analytics credits the visit that led to the purchase. Compare each against store revenue; if the platforms together claim more than the store earned, they are overlapping.
Sources
- [Google Analytics Help: [GA4] Session](https://support.google.com/analytics/answer/12798876)
- Google Analytics Help: Known bot-traffic exclusion
Was this article helpful?
We use your answers to fix and expand this page.
Couldn’t send. Please try again in a minute.
Thanks for the feedback. We’ll use it to improve this page.You’ve already sent feedback on this page. Thanks.

Data Analyst
Explores traffic sources, conversion funnels, and retention, using clear metric definitions and concrete examples to explain what the numbers mean.