Try it on your own data
Every report in this article is in the free plan. One snippet for web and apps, up to 10 sites.
Start freeA data analytics strategy is a short plan for how an organisation uses data to make specific decisions: which decisions it serves, what data they need, who owns each part and how value is judged. It fits on one page and starts from decisions, not tools. This guide gives the five questions to answer, a scored example where a weekly ad budget decision comes first, owner roles and a decision log with two rates you can track.
What you will learn
- Start from three to six recurring decisions, not tools: score each by frequency × value × data readiness and keep the top few
- Give every decision a decision owner, a metric owner and a data owner, and write each metric's definition once
- Judge value with a decision log: how often data changed the action (11 of 18 in the sample) and how often the change met its target (5 of 7)
What is a data analytics strategy, and how is it different from a data strategy?
A data analytics strategy is a short plan for how an organisation will use data to make specific decisions: which decisions it serves, what data they need, who owns each piece, and how the organisation will know the analysis was worth it. A data strategy in the wider sense covers storing, governing and managing data across the organisation; the analytics strategy sits on top and asks what that data is for. For the broader frame, see data strategy and data management strategy; this article is the decision-first version a small team can write in a day.
The test of a good one is that it fits on one page and a new hire can answer three questions from it: Which decisions does analytics support? Who is accountable for each number? How do we know it is working? Anything longer tends to describe tools, not choices.
What are the five questions a strategy must answer?
| Question | What you write down | Example (sample online store) |
|---|---|---|
| 1. Which decisions? | The 3 to 6 recurring decisions analytics must improve | Weekly ad budget split; quarterly pricing review |
| 2. What data? | The metric and source each decision needs | Revenue by channel, from the order ledger |
| 3. Who owns it? | A decision owner, a metric owner, a data owner | Head of growth; analyst; engineer |
| 4. What rhythm? | When each is reviewed | Weekly metric review, monthly decision review |
| 5. How is value judged? | A way to check that decisions improved | A decision log reviewed after 90 days |
Notice that tools, dashboards and models do not appear. They come after the decisions, as a means. The United States' Federal Data Strategy, a published example of a structured strategy, puts the same order in its practices: it begins by identifying the data needed to answer key questions, then covers governance roles and the value of data assets. Its setting (federal agencies) differs from a company's, but the sequence transfers.
| Question | What you write down | Example |
|---|---|---|
| Which decisions? | 3 to 6 recurring decisions | Weekly ad budget split |
| What data? | Metric and source per decision | Revenue by channel, from the order ledger |
| Who owns it? | Decision, metric and data owners | Head of growth; analyst; engineer |
| What rhythm? | When each is reviewed | Weekly metrics, monthly decisions |
| How is value judged? | A check that decisions improved | A decision log reviewed at 90 days |
Sample online store. Tools and dashboards come after the decisions.
Worked example: which decisions deserve analytics first?
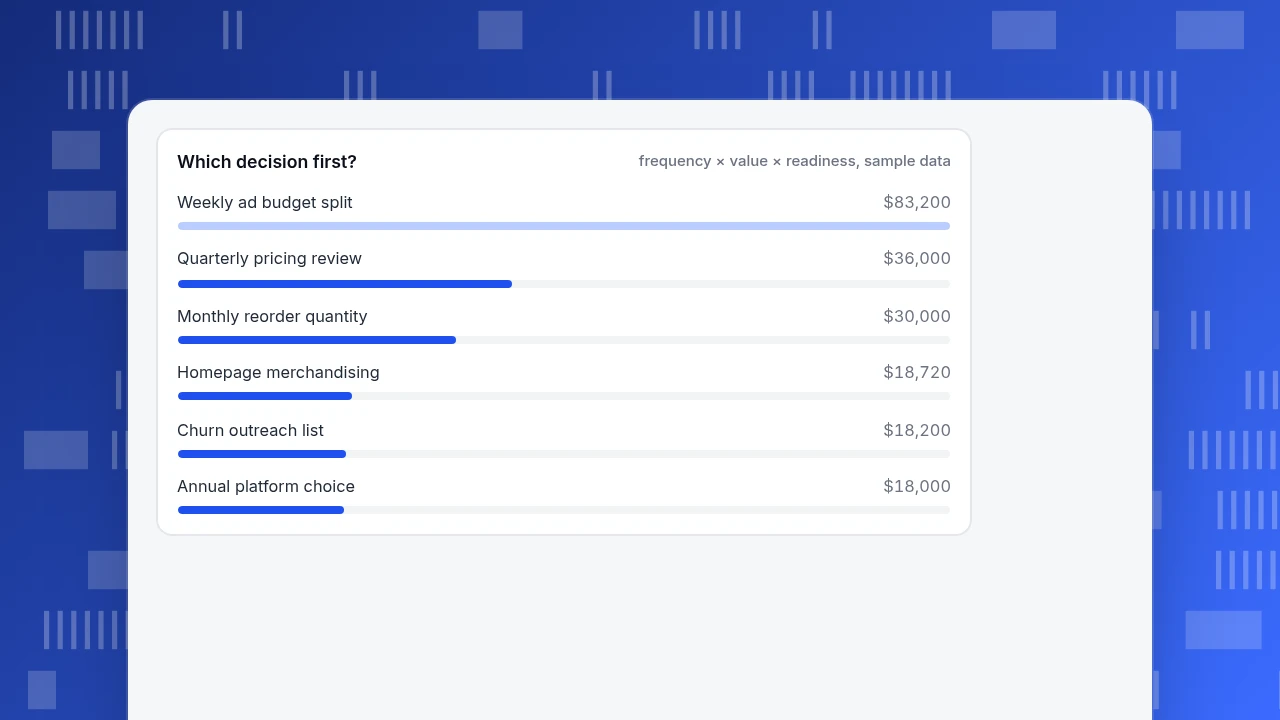
Start by listing candidate decisions and scoring them, so the first investment goes where it pays back. One workable score: how often the decision is made per year × value at stake each time × data readiness (0 to 1). Sample data for an online store:
| Decision | Times/year | Value per decision | Data ready | Score |
|---|---|---|---|---|
| Weekly ad budget split | 52 | $2,000 | 0.8 | $83,200 |
| Quarterly pricing review | 4 | $15,000 | 0.6 | $36,000 |
| Monthly reorder quantity | 12 | $5,000 | 0.5 | $30,000 |
| Homepage merchandising | 26 | $800 | 0.9 | $18,720 |
| Weekly churn outreach list | 52 | $500 | 0.7 | $18,200 |
| Annual platform choice | 1 | $60,000 | 0.3 | $18,000 |
The score is frequency × value × readiness, for example 52 × $2,000 × 0.8 = $83,200. The ranking is ads, pricing, reorder, homepage, churn, platform. The value at stake is an estimate of how much a better-informed choice is worth, not a measured number; its job is to force a comparison. The result is a clear first project: ad budget decisions every week, with data already 80% ready. The annual platform choice looks big but happens once and has the least ready data, so it can wait for a one-off study.
Keep the top three or four. A strategy that lists fifteen "priority" decisions has chosen none.
Which decision first?
frequency × value × readiness, sample dataWho should own what?
Each chosen decision needs three named roles, which can be the same person in a small team:
| Role | Responsible for | Example for "weekly ad budget split" |
|---|---|---|
| Decision owner | Making the choice and acting on it | Head of growth |
| Metric owner | The definition and the number being right | Analyst (revenue by channel, cost per order) |
| Data owner | The pipeline and collection that feed it | Engineer (events, order ledger, cost import) |
Write the metric's definition once, next to the owner, and use it everywhere. "Conversion rate" with two definitions in two dashboards is the most common cause of a meeting spent arguing about numbers. The Federal Data Strategy calls for putting authorities, roles and structures in place to manage strategic data assets; at company scale, the table above is that, in three rows per decision.
What data does each decision actually need?
Work backwards from the decision. For "weekly ad budget split":
| Need | Detail |
|---|---|
| Metric | Cost per order and revenue per channel, by campaign |
| Source | Ad spend import plus order ledger |
| Freshness | Updated daily; reviewed weekly |
| Quality check | Total orders match the shop's own count within a stated tolerance; spend totals match invoices |
| Known gap | Orders without UTM tags land in "direct" |
Writing the known gap is part of the strategy: it tells readers how far to trust the number. If a decision cannot be supported with data of acceptable quality, say so and either improve the collection or accept that judgement will decide it.
What rhythm keeps it alive?
A strategy that is read once does nothing. Three recurring meetings are enough:
- Weekly, 20 minutes: the metric owners read their numbers and flag anything outside its usual range.
- Monthly, 45 minutes: the decision owners review decisions made and the actions taken, using the decision log.
- Quarterly, 60 minutes: revisit the one-page strategy: are these still the right decisions, and did anything change in the data?
For the reporting side, see data storytelling; in these meetings keep to the number, the owner and the action.
How do you judge whether the strategy is working?
Keep a decision log: one line per decision with the date, the data used, the default action you would have taken without it, the action chosen, and a check date. After 90 days, mark whether the outcome met the expectation.
Sample data after one quarter: 18 decisions logged; in 11 of them the data changed the action from the default (11 ÷ 18 = 61.1%); 7 had reached their 90-day check; 5 of those met their target (5 ÷ 7 = 71.4%). The two numbers answer different questions: the first says whether analytics is influencing choices, the second whether the influenced choices were good. If the first is near zero, the analysis is being produced and ignored; if the second is low, the numbers or their interpretation need work. Small samples mean these rates are noisy, so look at the trend over several quarters and read the individual entries.
The Federal Data Strategy likewise asks organisations to assign value to data assets based on maturity, key questions and stakeholder feedback. A decision log is a cheap way of doing that without a valuation model.
How does the plan change as the organisation grows?
| Stage | Typical situation | Strategy focus |
|---|---|---|
| Starting | One tool, one person pulling numbers | Choose 3 decisions; define 5 metrics |
| Growing | Several teams, several dashboards | Name owners; one definition per metric |
| Established | Many sources, central team | Data quality checks, access rules, review cycle |
Do not borrow the next stage's process early. A three-person team does not need a data council; it needs three decisions and a definition list. For a fuller maturity ladder, see data maturity model.
Which mistakes sink a data analytics strategy?
- Starting from tools. The tool list is the output of the plan, not the plan.
- Too many priorities. More than four means no one is accountable.
- No named owners. A metric everyone owns is owned by no one.
- Two definitions for one metric. Resolve it in the written definition.
- No review rhythm. The strategy is read at launch and never again.
- Measuring dashboards built instead of decisions improved. Activity is not value.
How to put the plan into practice with TapCub
Take the weekly ad budget decision from the example.
- Record the events and owners. In All-platform analytics › Data › Tracking plan, add the events you need (for instance
purchase) with owner, developer, status and notes. Turn on live verification to see arrivals and required-property completeness in the last 24 hours. - Define the metric once. In All-platform analytics › Behavior › Metrics & SQL, save a custom metric by formula or by event and aggregation, so every dashboard uses the same definition.
- Import the spend. In All-platform analytics › Business › Channel ROI, import spend by day, channel, source or campaign; the page gives cost per click, cost per acquisition and return on ad spend, grouped by channel, source or campaign.
- Watch for drift. Add a monitor in All-platform analytics › Operations › Monitors on a key metric, so an outlier raises a notification rather than waiting for the monthly meeting. Subscribe the weekly metric owners to a scheduled report under Configuration › Settings › Notifications if your plan includes it.
- Keep the log outside. TapCub does not hold a decision log or assign decision owners; keep that in your own document, and use Configuration › Annotations to mark when decisions took effect on the charts.
TapCub supplies the measurement layer. It does not buy or bid on ads, and it does not decide the strategy for you.
FAQ
What is a data analytics strategy?
A short plan for how an organisation uses data to make specific decisions: which decisions, what data, who owns each part and how value is judged. A data strategy covers storing and governing data more broadly; the analytics strategy asks what the data is for.
What should a data analytics strategy include?
Five things: the three to six decisions it serves, the metric and data source each needs, named decision, metric and data owners, a review rhythm, and a way to judge value such as a decision log. Tool choices come afterward.
How do you build a data analytics strategy?
List candidate decisions, score them by frequency × value × data readiness, keep the top three or four, assign owners, write each metric's definition once and set a weekly, monthly and quarterly review. In the sample, the weekly ad budget split scored highest at $83,200.
How do you measure the success of a data analytics strategy?
Keep a decision log and check two rates: how often data changed the action (11 of 18, 61.1%, in the sample) and how often the changed actions met their target at the 90-day check (5 of 7, 71.4%). Read the trend across quarters.
Who should own the data analytics strategy?
A named executive or team lead owns the one-page plan, but accountability sits with each decision, metric and data owner. In a small company one person can hold all three roles; write them down anyway.
Sources
- Federal Data Strategy. Practices — Practice 1 (identify data needs to answer key agency questions), Practice 11 (prioritise data governance: authorities, roles and structures) and Practice 17 (recognise the value of data assets). Read 2026-11-19.
- Federal Data Strategy. Principles — ten principles grouped as ethical governance, conscious design and learning culture, ending with accountability. Read 2026-11-19.
Was this article helpful?
We use your answers to fix and expand this page.
Couldn’t send. Please try again in a minute.
Thanks for the feedback. We’ll use it to improve this page.You’ve already sent feedback on this page. Thanks.

Product Experience Specialist
Writes about product experience, practical workflows, and growth, turning complex processes into clear steps for everyday decisions.