Try it on your own data
Every report in this article is in the free plan. One snippet for web and apps, up to 10 sites.
Start freeA dashboard template is a ready-made layout of tiles, metrics and charts that you fill with your own data. It saves layout time, but it cannot know your decisions, so you must change its metrics to fit them: write the decision beside each tile, cut tiles that have none, rename metrics to your definitions and add a comparison and a trigger to each.
What you will learn
- Pick a template by the decision it supports, then treat it as a first draft
- Cut every tile that cannot finish the sentence: if this moves, we will do something specific
- Rename each metric to your definition; a different denominator alone changed conversion from 2.50% to 2.77%
What is a dashboard template, and what does it save you?
A dashboard template is a ready-made arrangement of tiles: a layout, a list of metrics and a chart type for each. It saves the blank-page work of deciding what goes where. It does not save the harder work: deciding what each number means in your business, what counts as a problem, and who does something about it.
That split is the point of this guide. A template saves time on layout, but you have to change its metrics to fit the decisions you actually make. A template built for everyone is tuned for no one; the generic version of "conversion rate", for example, may not match the way your store counts a conversion. Treat a template as a first draft, edit it against your decisions, and the dashboard that comes out is smaller and sharper than the one you downloaded.
For the design logic behind layouts by role, see analytics dashboard; for a finance- and company-level view, KPI dashboard. This article is about the step between: picking a template and bending it.
Which template fits which decision?
Pick the template by the decision it supports, not by how good the preview looks. The table lists six common starting points. Tile counts are starting points to cut down, not targets.
Two rules apply to all of them. Every template should open with one outcome number (revenue, sign-ups, resolved conversations) and then show the drivers beneath it. And any template with more than eight tiles is a reference sheet, not a dashboard; plan to cut it. If your business is small, small business dashboard shows how few numbers are enough.
If two templates both seem to fit, break the tie with four tests:
- Count the tiles that have a decision. The template where more tiles map to something you actually do wins, even if it looks plainer.
- Check that the data exists. A tile needs an event or a field you already collect. A template that needs five sources you do not have is a project, not a shortcut.
- Look at the comparison it expects. Templates built for daily operations assume a same-weekday comparison; ones built for management assume month over month. Match it to your reader's rhythm.
- Check who can edit it. If the definitions live in a tile only one person can open, you have not saved time, you have moved the dependency.
| Template | Decision it supports | Starting tiles | Reader | Cadence |
|---|---|---|---|---|
| Traffic and acquisition | Where to spend effort on traffic | Sessions, new vs returning, top sources, top landing pages, goal conversions | Marketing team | Weekly |
| Ecommerce sales | Fix the site, the traffic or the offer | Revenue, sessions, conversion rate, orders, average order value, cart abandonment, top products | Store owner | Daily glance, weekly review |
| Marketing campaign | Keep, change or stop a campaign | Spend, sessions, conversions, cost per acquisition, return on spend | Channel owner | Weekly |
| Product usage | What to build or fix next | Active users, key feature use, activation rate, retention | Product team | Weekly |
| Customer support | Staffing and answer quality | Conversations, first response time, resolution rate, satisfaction | Support lead | Daily |
| Executive summary | Where to invest | 3 to 5 outcomes with target and trend | Leadership | Monthly |
Starting tile lists are for cutting down: keep only the tiles that name a decision.
How do you adapt a template in five steps?
- Write the decision next to every tile. For each tile, finish the sentence "If this moves by X, we will ___." Tiles that cannot finish the sentence are the first to go. Do this before touching any layout.
- Rename each metric to your definition. "Conversions" becomes "Completed purchases ÷ sessions, bots excluded". The denominator, the counted event and the exclusions belong in the tile's description. This is where most template dashboards quietly go wrong, and the worked example below shows a 0.27-point difference from nothing but a denominator.
- Attach a comparison and a trigger. Each number needs something to be judged against (previous period, same weekday, a target) and a line where someone acts. A number with no comparison is decoration.
- Reorder by reading path. Outcome first, drivers second, diagnostics third. Make the tile you check most often the largest and put it top left.
- Test it on someone who did not build it. Give a colleague ten seconds and ask two questions: "Is last week better or worse?" and "What would you look at next?" If they hesitate on either, the layout or the labels need work.
Keep the unedited template in a copy. Next quarter you will want to see what you removed and whether any of it earned its way back.
Worked example: cutting a 14-tile template to 7
Sample data: an online store imports a generic ecommerce template with 14 tiles. Step 1 asks each tile what decision it supports. The result:
| Tile | Decision it would change | Verdict |
|---|---|---|
| Sessions | Whether to push or pause traffic sources | Keep |
| Users | Same as sessions for the weekly decision | Cut: duplicate |
| New users | None this quarter | Cut: no decision |
| Pageviews | None | Cut: no decision |
| Bounce rate | Definitions vary and no one has a threshold | Cut: no decision |
| Average session duration | None | Cut: no decision |
| Top pages | Replaced by top products | Cut: replaced |
| Top countries | Matters only when shipping zones change | Cut: monthly view |
| Conversion rate | Whether the site or the traffic is the problem | Keep |
| Orders | The volume actually shipped | Keep |
| Average order value | Pricing, bundles, free-shipping threshold | Keep |
| Revenue | The outcome number | Keep |
| Cart abandonment rate | Whether to fix checkout | Keep |
| Top products | What to feature and restock | Keep |
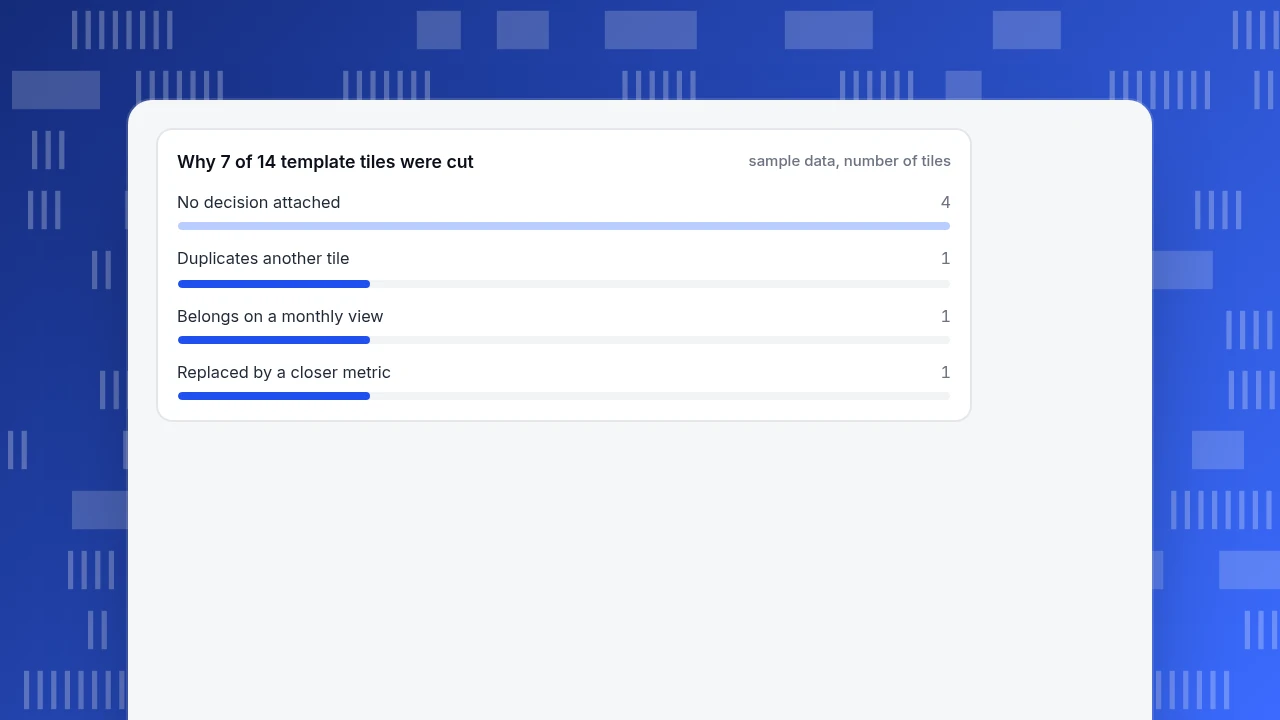
Seven kept, seven cut: 14 − 7 = 7. Of the cuts, four had no decision attached, one duplicated another tile, one belonged on a monthly view and one was replaced by a closer metric (4 + 1 + 1 + 1 = 7).
Step 2 then renames the definitions. Suppose last week had 310 orders, 12,400 sessions and 11,200 unique visitors:
- Orders ÷ sessions = 310 ÷ 12,400 = 2.50%
- Orders ÷ unique visitors = 310 ÷ 11,200 = 2.77%
Same store, same week, two "conversion rates", 0.27 points apart. Neither is wrong, but a dashboard that mixes them across tiles or weeks invents changes that never happened. Choose one, write it in the tile description, and keep it.
The finished dashboard reads outcome first (revenue), then the drivers in funnel order (sessions, conversion rate, orders, average order value), then the two diagnostics (cart abandonment, top products). Revenue is orders × average order value, so a movement in revenue can be traced to one of the tiles beside it. How this layout works as a working dashboard is in ecommerce dashboard.
Why 7 of 14 template tiles were cut
sample data, number of tilesHow do you set the line each tile is judged against?
A template ships with charts, not with judgement. Add two things to every tile: what it is compared with, and the move that triggers action. The values below are illustrative; set yours from your own history.
| Tile | Compare with | Act when |
|---|---|---|
| Sessions | Same weekday, previous 4 weeks (median) | More than 15% below for two days in a row |
| Conversion rate | Trailing 4-week median | More than 10% below for a full week |
| Average order value | Previous 4-week average | More than 8% away in either direction |
| Cart abandonment rate | Trailing 4-week median | More than 5 points above |
| Revenue | Target for the month, pro-rated | More than 10% behind pace at mid-month |
Three habits keep thresholds honest. Use the median rather than the mean when a promotion has inflated one week. Compare weekdays with weekdays, because a Tuesday and a Sunday are different days. And revisit the lines each quarter: a threshold set on three weeks of data goes stale quickly. If you use a template with built-in colours, check that the colours match your own lines, not the vendor's.
What are the common dashboard template mistakes?
- Keeping every tile "just in case". Each extra tile lowers the odds that the important one is read. Cut anything with no decision attached.
- Trusting the template's metric names. Two tiles both called "conversions" can count different events. Rename and describe each.
- Copying the same template for every audience. A weekly team view and a monthly management view need different tiles, not a different logo.
- Template first, question second. Starting from "which template looks good" instead of "what do we decide each week" produces a good-looking board nobody uses.
- Never retiring tiles. Review the dashboard each quarter and remove tiles nobody acted on.
- Connecting data before checking it. A template full of clean charts over broken tracking is worse than an empty one. Check that each tile's event fires before sharing the board.
- Using template colours as the threshold. Red and green set by default may mean nothing for your numbers; define the lines first.
Starting from a template in TapCub
Take the 14-to-7 example. In TapCub, the starting draft and the edit look like this:
- Install a starting set. In All-platform analytics › Business › Industry packs, the ecommerce / retail pack writes event definitions, metrics, goals, funnels and dashboards in one go. Its dashboards are named 电商经营 and 商品与转化 (the pack stores its names in Chinese). The pack does not send events for you: cards stay empty until your store reports
view_item,add_to_cart,begin_checkoutandpurchasewith an order number, amount and currency. - Trim in My dashboards. Open All-platform analytics › Overview › My dashboards. A card is a saved analysis, a text block or a divider, so you can delete the cards that fail step 1 and add a text card holding each metric's written definition. The board has its own date range and filters, and can be set as the default.
- Check the definitions against what TapCub counts. On All-platform analytics › Business › Commerce & revenue, average order value is revenue divided by orders, and abandonment is the share of sessions with an add-to-cart that did not buy. If your sheet defines them differently, write that difference on the card instead of hoping nobody notices.
- Pin and share. A dashboard can be pinned into the website, app or mini-program shell so it opens filtered to that platform, and shared as a read-only link with an optional password. Shared views cover at most the last 90 days. Saving needs an analyst or higher role; sharing needs an admin or owner.
TapCub provides the layout and the numbers. It does not choose your decisions, thresholds or targets for you, and a pack's dashboard is a first draft just like any other template: expect to cut tiles and rename metrics before it is yours.
FAQ
What is a dashboard template?
A dashboard template is a pre-built set of tiles with a layout, metrics and chart types that you fill with your own data. It saves layout work, but the definitions, comparisons and thresholds still have to come from your own decisions.
How do I create a dashboard from a template?
Write the decision each tile supports, delete tiles that cannot name one, rename metrics to your definitions, add a comparison and a trigger to each, then test it with a colleague for ten seconds.
How many tiles should a dashboard template have?
Aim for five to seven for a working team dashboard. Templates ship with more so you can choose; the example cut 14 tiles to 7 because half had no decision attached.
What metrics should a dashboard template include?
One outcome number first, then its drivers. For a store: revenue, then sessions, conversion rate, orders and average order value, with cart abandonment and top products as diagnostics. For other businesses the list differs; see KPI dashboard.
Can one template work for the whole company?
Not well. A weekly view for the team that fixes things and a monthly view for management need different tiles and comparisons. Start from the same template if you like, but edit a copy for each reader.
Sources
- Dashboard Confusion, Stephen Few, Perceptual Edge (2004): a dashboard is a single-screen display of the most important information for specific objectives.
- Grafana documentation: Dashboard best practices: guidance on keeping each dashboard purposeful and avoiding dashboard sprawl.
Was this article helpful?
We use your answers to fix and expand this page.
Couldn’t send. Please try again in a minute.
Thanks for the feedback. We’ll use it to improve this page.You’ve already sent feedback on this page. Thanks.

Product Experience Specialist
Writes about product experience, practical workflows, and growth, turning complex processes into clear steps for everyday decisions.