Try it on your own data
Every report in this article is in the free plan. One snippet for web and apps, up to 10 sites.
Start freeDashboard reporting turns a dashboard's numbers into a regular report: a one-sentence conclusion, three to five numbers with comparisons, the reason for the biggest change and an action with an owner and a date. A dashboard shows; a report concludes. Send one only to readers who will not open the dashboard or who must act together, and keep it to what changes their next decision.
What you will learn
- A dashboard is for looking; a report earns its place only with a conclusion and an action
- Put a headline, 3 to 5 compared numbers, the reason, an owned action and data notes, in that order
- Explain changes by splitting the metric into factors and one dimension at a time, and label confidence
What is dashboard reporting, and how is it different from a dashboard?
A dashboard is a screen you look at. Stephen Few's often-quoted definition describes it as the most important information for one or more objectives, arranged on a single screen so it can be monitored at a glance. A report is a message someone sends you: it picks a period, says what happened and what to do about it. Dashboard reporting is the practice of using the first to produce the second, on a schedule, for people who will not open the dashboard themselves.
The two fail in different ways. A dashboard fails when nobody looks at it. A report fails when it only repeats numbers the reader could already see. The table below sets the two side by side.
Everything in this guide follows from one rule: a dashboard shows, a report concludes. A periodic report earns its place only if it contains a conclusion and an action. If you want the mechanics of scheduling and delivery instead, they are covered in automated reports; how to lay out the dashboard itself is in analytics dashboard.
| Aspect | Dashboard | Report |
|---|---|---|
| Purpose | Let people look when they choose | Tell people what changed and what to do |
| Who starts it | The reader opens it | The sender pushes it |
| Time frame | Live or a chosen range | A fixed period, compared with the previous one |
| Must contain | The numbers, filters and drill-downs | A conclusion, a reason and an owned action |
| Fails when | Nobody looks | It only repeats numbers the reader can see |
| Owner | Whoever maintains the board | Whoever signs the conclusion |
Use the dashboard to produce the numbers and the report to carry the decision.
When do you need a report on top of the dashboard?
Not every dashboard needs a report. Use these rules to decide:
- If the reader never opens the dashboard, send a report. Executives, clients and partners usually fall here.
- If more than one person has to act on a change, send a report. A shared message with an owner and a date beats five people reading the same chart and drawing five conclusions.
- If the numbers need context to be read correctly (a promotion, a release, a holiday, a tracking change), send a report. The context belongs in the message.
- If the same people look at the same dashboard at the same time every week anyway (for example in a stand-up), the dashboard is the report. Add a report only when decisions are being lost.
- If nothing changed, the report can be two lines long: headline and "no action". A short report that says nothing happened is useful; a long one that pretends something did is not.
What does a dashboard report contain?
A report that gets read has five parts, in this order. The order matters because many readers stop after the first part.
- Headline (one sentence). The conclusion with its biggest number: what moved, by how much, and the main reason. Write it last, put it first.
- The numbers (3 to 5). Each with a comparison: this period, the previous period, the change in percent. More than five and the reader stops comparing. Pick them from the dashboard's top row.
- What changed and why. Decompose the biggest movement (by channel, page, product or segment) and label how sure you are: confirmed, likely or unknown.
- Action, owner, date. One to three lines. "Restore paid social budget, marketing lead, by Monday" is an action. "Keep an eye on traffic" is not.
- Data notes. Anything that makes the numbers less comparable: a tracking change, a missing day, a bot filter change. Two lines at most.
A useful test: delete everything except part 1 and part 4. If the reader still knows what to do, the report works. If they need parts 2 and 3 to find out, the headline is not a conclusion yet.
Worked example: one weekly report from a dashboard
Sample data: a small online store compares last week with the week before. The dashboard has the four numbers below. Everything is recomputed in the table.
| Metric | Prior week | Last week | Change |
|---|---|---|---|
| Sessions | 13,800 | 12,400 | −10.1% (−1,400 ÷ 13,800) |
| Orders | 345 | 310 | −10.1% (−35 ÷ 345) |
| Conversion rate (orders ÷ sessions) | 2.50% | 2.50% | 0.00 points |
| Average order value | $56 | $58 | +3.6% (+2 ÷ 56) |
| Revenue (orders × AOV) | $19,320 | $17,980 | −6.9% (−1,340 ÷ 19,320) |
Read as a dashboard, this is five red and green numbers. Read as a report, there is one story: conversion did not move and order value rose, so revenue fell because traffic fell. Orders fell by exactly the same 10.1% as sessions.
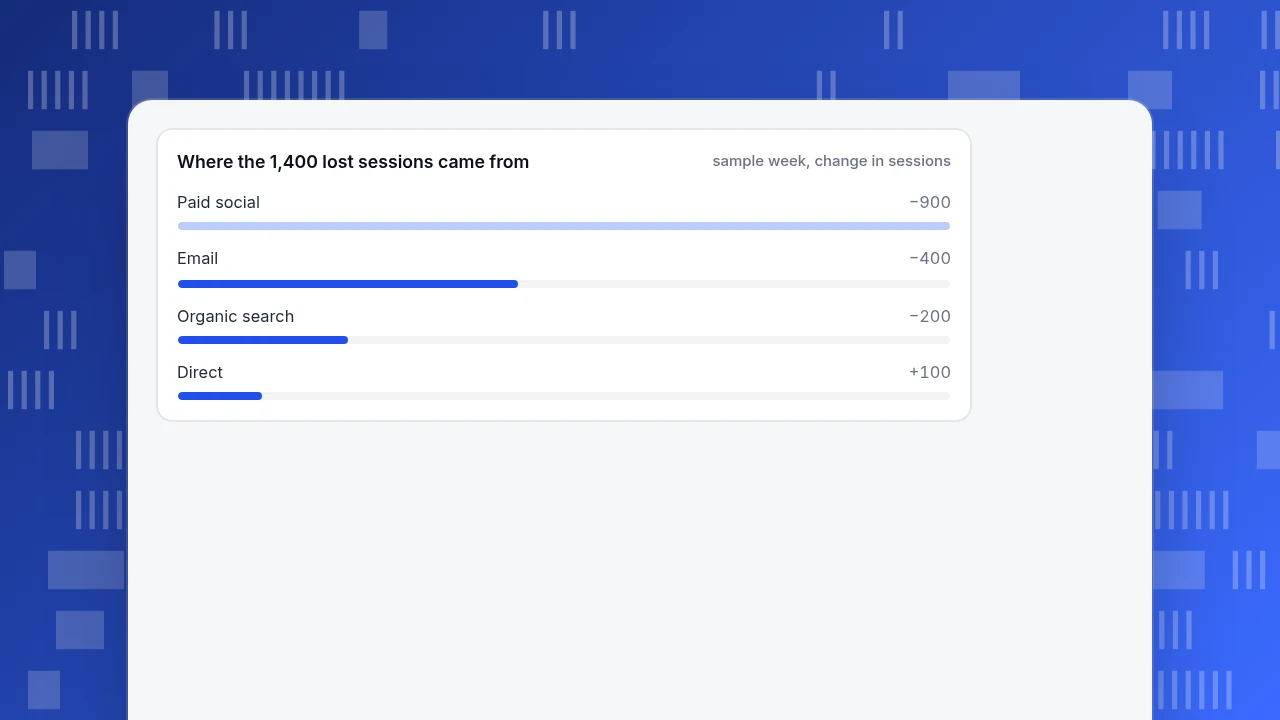
The next question is where the 1,400 lost sessions went. Splitting sessions by channel:
| Channel | Prior week | Last week | Change | Share of the net drop |
|---|---|---|---|---|
| Paid social | 3,000 | 2,100 | −900 | 64.3% |
| 2,400 | 2,000 | −400 | 28.6% | |
| Organic search | 5,200 | 5,000 | −200 | 14.3% |
| Direct | 2,500 | 2,600 | +100 | −7.1% |
| Referral | 700 | 700 | 0 | 0.0% |
| Total | 13,800 | 12,400 | −1,400 | 100.0% |
The shares add up to 100% because −900 −400 −200 +100 = −1,400. Assume (sample assumption) that paid social spend was paused for two days and one email campaign was skipped. The finished report reads:
Headline: Revenue fell 6.9% ($19,320 → $17,980) because sessions fell 10.1%; conversion held at 2.50% and order value rose 3.6%. Paid social and email explain 93% of the lost sessions (1,300 of 1,400). Numbers: sessions 12,400 (−10.1%), orders 310 (−10.1%), conversion 2.50% (flat), AOV $58 (+3.6%), revenue $17,980 (−6.9%). Why: confirmed for paid social (spend paused two days); likely for email (one campaign skipped, not yet verified in the send log). Action: restore paid social budget, marketing lead, by Monday; confirm the email send schedule, CRM owner, by Wednesday. Data notes: none this week.
Note what the report did not do: it did not list pageviews, bounce rate or top pages, because none of them changed the conclusion. That restraint is most of the skill.
Where the 1,400 lost sessions came from
sample week, change in sessionsHow often should a dashboard report go out?
Choose the rhythm from how fast the reader can act, not from how fast the data updates. The table is a starting point, not a rule.
| Cadence | Reader | Numbers | Comparison | Length |
|---|---|---|---|---|
| Daily | The person who can fix things today | 2 to 3, plus alerts | Same weekday last week | 3 lines |
| Weekly | The team that owns the numbers | 4 to 5 | Previous week | One screen |
| Monthly | Management or a client | 5 to 7 | Previous month and the same month last year | One page |
| Quarterly | Leadership | 3 to 5 outcomes | Target and previous quarter | One page plus a decision list |
Two cautions. Daily reports on noisy numbers teach readers to ignore the report: a store with 40 orders a day will see double-digit swings from chance alone. And a monthly report cannot be the first place anyone learns about an outage, so keep alerts for that; reports are for trends and decisions, not emergencies.
How do you explain a change without guessing?
The "why" is the part of a report that is most often invented. Use a short routine:
- Split the metric into factors. Revenue = sessions × conversion rate × average order value. In the example, conversion was flat and order value rose, so only sessions could explain the fall.
- Split the factor that moved by one dimension at a time: channel, device, country, landing page. Stop when one slice holds more than half of the change, as paid social did at 64.3%.
- Check what changed on your side before looking outside: campaigns, releases, price changes, tracking changes.
- Label the confidence. Confirmed means you saw the cause (a paused campaign in the ad account). Likely means the timing fits but you have not verified it. Unknown means say so. A report that says "unknown, investigating, owner and date" is more useful than a confident story that turns out wrong.
- Beware of small slices. A segment that moved 40% on 25 sessions is noise; say "too small to read".
What are the common dashboard reporting mistakes?
| Mistake | What goes wrong | Fix |
|---|---|---|
| Pasting dashboard screenshots with no text | Readers see numbers but no conclusion; every reader invents their own | Put the headline above the screenshot |
| Reporting everything that is available | The one number that matters is buried | Cap at five numbers; move the rest to an appendix link |
| No comparison | "12,400 sessions" means nothing without last week | Show previous period and percent change for every number |
| Colour as the only signal | Red and green alone are hard to read for colour-blind readers | Add a word or arrow next to the colour, as WCAG's Use of Color criterion asks |
| Different definitions week to week | A change in the number is a change in the definition | Freeze definitions; log any change in the data notes |
| Action without owner and date | Nobody does it | Every action gets a name and a day |
| Sending a report no one asked for | The inbox trains people to skim | Ask once a quarter: what did you decide from this? |
Dashboard reporting in TapCub
Take the weekly store report above. In TapCub it comes together like this:
- Build the dashboard once. In All-platform analytics › Overview › My dashboards, a card is a saved analysis, a text block or a divider. Put the five numbers in the top row and a text card for the data notes. The board has its own date range and filters, and can be the default dashboard.
- Get the numbers with a comparison. Web analytics › Reports lists the core metrics by date with "show change" against the previous period or the same period last week, and the columns you pick are stored in the link, so a colleague sees the same columns.
- Send the weekly report. In Configuration › Settings › Notifications, the "Subscription reports" block can send a daily, weekly or monthly report to WeCom, DingTalk, Feishu, a webhook or email. It covers visitors, pageviews, sessions, bounce rate and average duration with change, the traffic trend, fastest-rising pages and sources, new sources, goal conversions and a short interpretation written by rules first. Subscription reports need a plan that includes them, and saving needs an admin or owner.
- Mark the causes. Add release and campaign dates in Configuration › Annotations, so the "why" is already on the chart.
- Share read-only. A dashboard can be shared by read-only link, with an optional password; shared views cover at most the last 90 days.
TapCub produces the numbers, the comparison and a rule-based interpretation. It does not write your action line or pick an owner: parts 3 and 4 of the report are still yours. Also, the subscription report is generic; a headline like "paid social explains 64% of the drop" comes from you splitting sessions by channel in Web analytics › Sources.
FAQ
What is dashboard reporting?
Dashboard reporting means turning a dashboard's numbers into a regular report: a headline conclusion, a few numbers with comparisons, a short explanation and an action with an owner and date. The dashboard is for looking; the report is for people who need to decide.
What is the difference between a dashboard and a report?
A dashboard is a live view you open when you want to look. A report is a message with a period, a conclusion and an action. Dashboards answer "what is happening now"; reports answer "what changed and what do we do".
How many metrics should a dashboard report include?
Three to five numbers in the body, each with a comparison. The example above used five and still ended with a single conclusion. Move supporting detail to a linked dashboard rather than the message.
How often should I send a dashboard report?
Match the rhythm to how fast the reader can act: weekly for the team that owns the numbers, monthly for management or clients. Daily reports suit only numbers with enough volume that day-to-day moves are not mostly chance.
Can I automate a dashboard report?
Yes, the numbers and the comparison can be scheduled. The conclusion and the action still need a person. See automated reports for what to automate and what to leave manual.
Sources
- Dashboard Confusion, Stephen Few, Perceptual Edge (2004): the definition of a dashboard as a single-screen, at-a-glance display.
- Understanding Success Criterion 1.4.1: Use of Color, W3C WCAG 2.2: why colour must not be the only way to convey status.
Was this article helpful?
We use your answers to fix and expand this page.
Couldn’t send. Please try again in a minute.
Thanks for the feedback. We’ll use it to improve this page.You’ve already sent feedback on this page. Thanks.

Customer Experience Consultant
Writes about live chat, visitor conversations, and self-service, sharing practical ways to make customer communication clearer and more effective.