Try it on your own data
Every report in this article is in the free plan. One snippet for web and apps, up to 10 sites.
Start freeA data insight is a finding that explains something in your data and points to a decision: what changed compared with what, why, and what to do about it. A chart is not an insight. In the worked example below, conversion falls from 3.0% to 2.5% while no device got worse; the cause is a shift to mobile traffic, the real gap is one mobile checkout step (27.3% against 50.0%), and fixing it is worth about 75 orders a month.
What you will learn
- An insight has three parts: see (compared with what), explain (and survive a breakdown), act (decision, owner, date)
- Split a moving total before explaining it; the drop in the example was entirely traffic mix
- Size the finding in orders or money before choosing the fix
What are data insights?
A data insight is a finding in your data that explains something and points to a decision. A chart that shows a number is not an insight; a chart plus "this is why, and this is what we should do about it" is. Three levels are easy to confuse, and the difference is what separates a report from a decision.
| Level | What it is | Example (sample data) | Can you act on it? |
|---|---|---|---|
| Data | Raw records | 10,000 sessions, 250 orders last month | No |
| Information | A summarised fact | Conversion rate fell from 3.0% to 2.5% | Not yet: you do not know why |
| Insight | A fact, its cause and what to do | The drop is all traffic mix; mobile checkout converts at 27.3% vs 50.0% on desktop; fix that step | Yes |
The test is simple: after reading it, can someone say what they will do differently on Monday? If not, you have information, not an insight. Metrics that are built to prompt action are covered in actionable metrics; this guide is about the step after the metric, going from a number that moved to a decision.
What makes an insight? See, explain, act
Every real insight has the same three parts, and each can be checked with a question.
- See: what changed or differs, compared with what? "Conversion is 2.5%" is not enough. "Conversion is 2.5% against 3.0% last month" is. An insight always has a comparison: last period, another segment, a target.
- Explain: why, and how do you know? The explanation should survive a breakdown. If you say mobile traffic caused it, splitting by device must show it.
- Act: what decision does this change, who owns it, and how will you know it worked? Name the decision, an owner, and the number you will look at again.
A finding that stops after the first part is a report. One that stops after the second is a good story that nobody uses. The reason many dashboards fail is that they stop at "see"; the thinking about structure is in analytics dashboards and the communication side in data storytelling.
| Level | Example | Can you act? |
|---|---|---|
| Data | 10,000 sessions, 250 orders | No |
| Information | Conversion fell from 3.0% to 2.5% | Not yet |
| Insight | Mix shift to mobile; mobile checkout converts 27.3% vs 50.0%; fix that step | Yes |
The test: can someone say what they will do differently on Monday?
Worked example: from a falling conversion rate to a decision
Sample data: an online store compares two months. Sessions are 10,000 both months.
See. Conversion rate fell from 3.0% (300 orders) to 2.5% (250 orders): a drop of 0.5 points, or 16.7% in relative terms.
Explain, step 1: split by device.
| Last month: sessions | Conversion | Orders | This month: sessions | Conversion | Orders | |
|---|---|---|---|---|---|---|
| Desktop | 6,000 | 4.0% | 240 | 4,000 | 4.0% | 160 |
| Mobile | 4,000 | 1.5% | 60 | 6,000 | 1.5% | 90 |
| Total | 10,000 | 3.0% | 300 | 10,000 | 2.5% | 250 |
Neither device got worse. Desktop converts at 4.0% both months and mobile at 1.5% both months. What changed is the mix: mobile went from 40% to 60% of sessions. Check the arithmetic: 0.6 × 1.5% + 0.4 × 4.0% = 0.9% + 1.6% = 2.5%. The entire drop is a mix effect. A campaign that brought extra mobile visitors did not harm conversion; it exposed a weakness.
Explain, step 2: find the step where mobile loses people.
| Funnel step | Mobile (6,000 sessions) | Step rate | Desktop (4,000 sessions) | Step rate |
|---|---|---|---|---|
| Product view | 3,300 | 55.0% | 2,400 | 60.0% |
| Add to cart | 660 | 20.0% | 560 | 23.3% |
| Checkout started | 330 | 50.0% | 320 | 57.1% |
| Order | 90 | 27.3% | 160 | 50.0% |
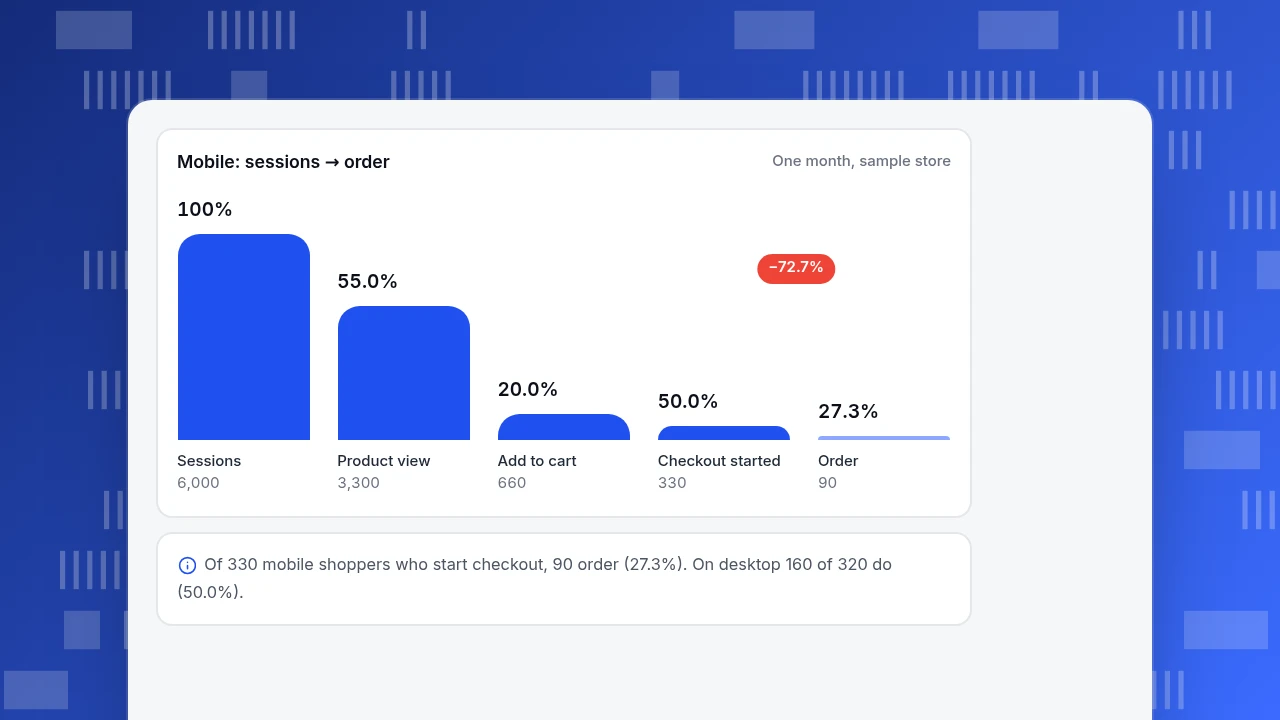
Mobile is a bit weaker on every step, but the real gap is the last one: of mobile shoppers who start checkout, 27.3% order, against 50.0% on desktop.
Act. Size the fix before choosing it. If mobile checkout matched desktop, orders from mobile would be 330 × 50.0% = 165 instead of 90, which is 75 more orders a month. Assume each order brings $50 revenue at 40% gross margin: 75 × $50 × 0.40 = $1,500 of extra margin a month, as an upper bound. The decision is to investigate the mobile checkout, not to pause the campaign, and to review the mobile checkout-to-order rate again in two weeks. Assigning an owner and a date is what turns this from a finding into an insight.
Mobile: sessions → order
One month, sample storeSessions
6,000
Product view
3,300
Add to cart
660
Checkout started
330
Order
90
How do you go from data to a decision?
The example followed a pattern that works for most questions. Six steps, each with a rule for when to stop.
- Start with a question or a number that moved. Without one you are browsing. Write the question in one sentence.
- Compare. Against last period, the same weekday last week, another segment or a target. Stop when you have a difference worth explaining.
- Break it down. By channel, device, country, new vs returning, landing page. Stop when the change concentrates in one slice, or when you find it does not (as with the device split, where neither slice changed).
- Find the mechanism. A funnel, a path or a session recording shows the step or behaviour behind the number. Stop when you can describe what people do, in plain words.
- Size it. Convert the finding into orders, revenue or hours. Stop if the size is too small to justify the work.
- Decide and set a check. Name the action, the owner, the metric and the date for the next look.
Methods for the earlier steps of the process are in how to analyze data.
How do you know an insight is real?
Insights go wrong in predictable ways. Run these checks before acting.
| Check | The risk | What to do |
|---|---|---|
| Sample size | A change in a small group is noise | Do not act on a segment with only a few dozen conversions; wait or combine periods |
| Mix effects | The total moves while no segment does | Always split a moving rate by the biggest dimension, as in the device example. This is the pattern known as Simpson's paradox |
| Seasonality | A normal weekly or yearly cycle looks like a change | Compare the same weekday or the same period last year, not the previous day |
| Many slices | Look at 20 breakdowns and one will look unusual by chance (20 × 5% = 1) | Decide which breakdowns matter before looking, and treat a lone surprise as a hypothesis |
| Correlation | Two things move together without one causing the other | Look for a mechanism, or test the change |
| Data quality | Bots, tracking changes or a broken tag created the movement | Check bots and tag changes before any explanation |
Berkeley's graduate admissions data in the early 1970s is the textbook case of a combined rate telling a different story from the groups it is made of. The point for you: when a total changes, split it before explaining it. When two reports disagree, see data discrepancies; when the numbers cannot tell you why, see qualitative vs quantitative data.
Where do good insights come from?
Numbers show what happened; other evidence explains why. Strong insights combine at least two sources.
- Behaviour data: funnels, retention, paths, segments. Good for finding where and for whom.
- Observation: heatmaps and session recordings of the step you found. Good for seeing what people actually do.
- Conversations: chat transcripts and support questions. Good for hearing the reason in the customer's words. In the example, a handful of mobile chats mentioning a payment form would explain the 27.3% faster than any chart.
- Outside context: a campaign calendar, a price change, a holiday, a competitor event. Good for ruling in or out a cause.
Keep a short log of releases and campaigns with dates so explanations are not guessed afterwards.
Common mistakes with data insights
- Calling a chart an insight. If nobody can say what to do differently, it is information.
- Explaining before splitting. In the example, "the campaign hurt conversion" was the first guess and wrong; no segment got worse.
- Skipping the size. A true finding worth $40 a month is not worth an engineering sprint. Size it first.
- No owner and no date. A finding with no owner is a conversation, not a decision.
- Never checking back. An insight is a hypothesis until the metric moves; schedule the second look.
- Too many insights. Ten weak findings bury one strong one. Rank by size × confidence and ship the top one or two.
- Trusting the tool's automatic findings blindly. Automatic highlights are leads to check, not conclusions.
How to find data insights in TapCub
Take the store from the example. TapCub shows the numbers and helps trace the cause; the decision and the fix stay with you.
- Ask why it changed. In All-platform analytics › Operations › AI Assistant, open the Why did it change tab (the button on an answer carries the current metric over). Compare with the previous period and split by device or channel. For each value it shows how much it contributed: its change divided by the total change. That can exceed 100% or go negative when parts move in opposite directions: on orders, desktop is −80 and mobile +30 against a total of −50, so 160% and −60%. The numbers come from analysis queries run on your project, so check them against your own reading.
- Confirm with a segment. In All-platform analytics › Behavior › Behavior analysis, split the rate by device and see that neither device changed while the mix did, as in the example.
- Find the step. Build the funnel in Behavior analysis for mobile and for desktop and compare each step; the checkout-to-order gap is the one to open.
- Watch what people do. Turn on Session replay for that step (it is off by default) and watch mobile checkout sessions, or open Live chat › Inbox to read what mobile shoppers asked. Each conversation arrives with the visitor's source, current page and recent browsing.
- Mark and monitor. Add a date annotation under Configuration › Annotations for the change you ship. Under All-platform analytics › Operations › Monitors you can save a custom metric for mobile checkout-to-order and be notified when it crosses a line. Monitors only notify; they do not change anything.
TapCub does not rank insights or decide for you. The AI Assistant does not create monitors or send notifications, and buttons such as Save as insight are ones you click yourself.
FAQ
What are data insights?
Data insights are findings in your data that explain something and point to a decision. They go beyond a chart or a number: they say what changed compared with what, why it changed and what to do about it. If nobody can name the next action, it is information, not an insight.
What is the difference between data, information and insight?
Data is raw records, such as 10,000 sessions and 250 orders. Information is a summarised fact, such as conversion falling from 3.0% to 2.5%. An insight adds the cause and the action: the drop came from a shift to mobile traffic, and mobile checkout needs fixing.
How do you turn data into actionable insights?
Start with a question, compare against a baseline, break the number down by the biggest dimensions, find the mechanism with a funnel or recording, size the finding in orders or money, and decide with an owner and a date. Check back to see whether the metric moved.
What are examples of data insights?
A falling total that is really a traffic-mix shift, a checkout step where mobile loses twice as many shoppers as desktop, or a segment of customers who stop returning after their third week. Each names a segment or step and suggests a specific action.
Can data insights be wrong?
Yes. Small samples, mix effects, seasonality, many slices and tracking errors all create false findings. Split a moving total before explaining it, compare like periods, and treat a single surprising slice as a hypothesis to test rather than a conclusion.
See also: Business Analytics Examples: 8 Questions and the Data That Answers Them.
Sources
- Stanford Encyclopedia of Philosophy. Simpson's Paradox — how a combined rate can differ from the rates of the groups; discusses the Berkeley admissions example from Bickel et al. (1975). Checked 2026-11-19.
- NIST/SEMATECH e-Handbook of Statistical Methods. What is EDA? — exploratory data analysis as an approach to looking at data before assuming a model. Checked 2026-11-19.
Was this article helpful?
We use your answers to fix and expand this page.
Couldn’t send. Please try again in a minute.
Thanks for the feedback. We’ll use it to improve this page.You’ve already sent feedback on this page. Thanks.

Customer Experience Consultant
Writes about live chat, visitor conversations, and self-service, sharing practical ways to make customer communication clearer and more effective.