Try it on your own data
Every report in this article is in the free plan. One snippet for web and apps, up to 10 sites.
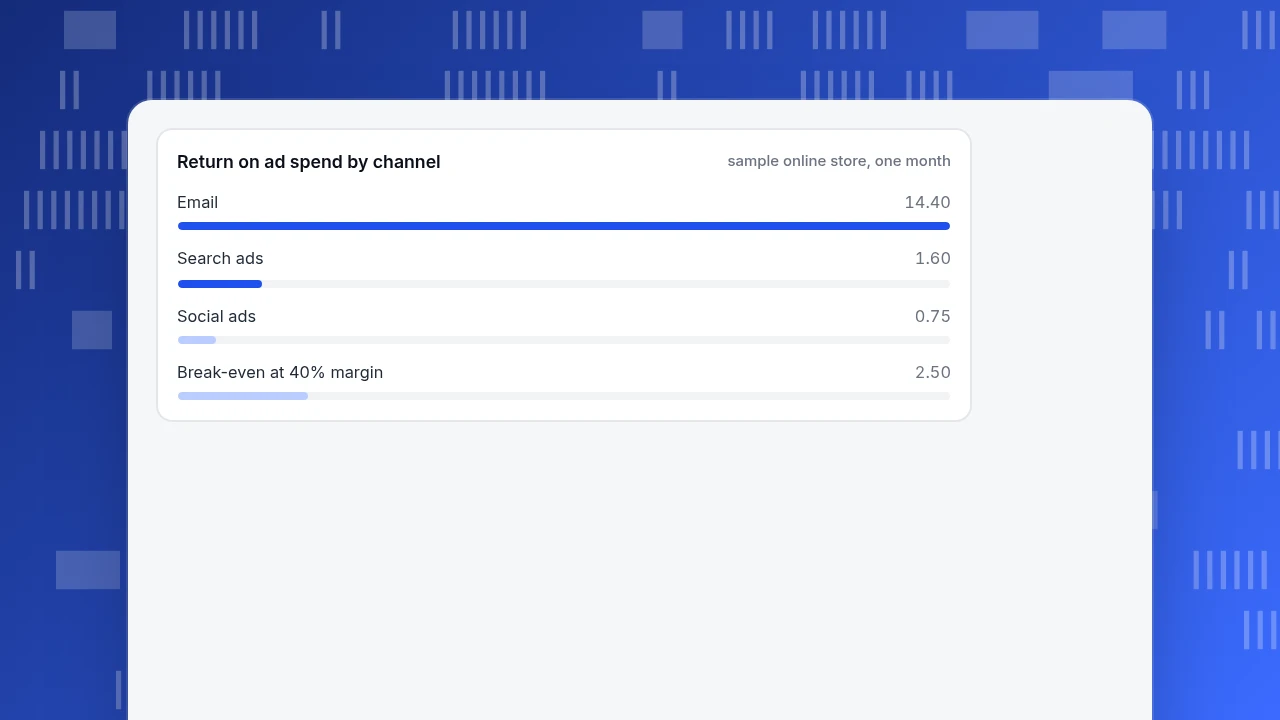
Start freeA business analytics example is a question someone must answer, the metric that answers it and the decision it changes: which channels pay back, where buyers drop out, whether customers return, whether chat helps, which pages lose people, whether a release broke something, who is slipping away and whether the market is growing faster than you. Below are eight, with one fully worked: in the sample, search returned $1.60 per $1 against a break-even of $2.50.
What you will learn
- Write each analysis as question, metric, threshold, decision and owner before building the report
- Judge channels on margin, not revenue: at a 40% margin the break-even return on ad spend is 2.5
- Use an outside benchmark for market questions, and treat raw chatted-vs-not gaps as an upper bound
What does a good business analytics example look like?
A good business analytics example has three parts in a fixed order: a question someone has to answer, the metric that answers it, and the decision the answer changes. If you cannot name the decision, the metric is a number on a dashboard, not analytics.
The examples below follow that pattern with a short calculation where one helps. They cover a small online business, but the question-metric-decision shape carries over to a subscription product, a content site or a service. The metric definitions behind them are in business metrics, and turning a number into a recommendation is covered in data insights; this page is the worked-case catalogue.
Which eight questions are worth turning into analytics?
| # | Business question | Metric that answers it | Decision it changes |
|---|---|---|---|
| 1 | Which channels pay back? | Return on ad spend and cost per acquisition by channel | Move budget between channels |
| 2 | Where do buyers drop out? | Conversion between ordered steps (funnel) | Fix the weakest step first |
| 3 | Do new customers come back? | Retention in week 1, week 4 | Change onboarding or follow-up |
| 4 | Does live chat help sales? | Goal conversion of chatted vs not-chatted visitors | Staff chat hours or not |
| 5 | Which pages lose people? | Bounce and exit by page and source | Rewrite or retarget the page |
| 6 | Did the release break anything? | Error rate and Core Web Vitals before and after | Roll back or hotfix |
| 7 | Which customers are slipping away? | Recency and frequency groups, dormant counts | Send a win-back to the right group |
| 8 | Is the market growing faster than we are? | Our online sales growth against an outside benchmark | Invest more or hold |
The rest of this page works through the ones that need explaining, starting with the one with the most arithmetic.
| Business question | Metric | Decision it changes |
|---|---|---|
| Which channels pay back? | Return on ad spend and cost per acquisition | Move budget between channels |
| Where do buyers drop out? | Step conversion in a funnel | Fix the weakest step first |
| Do new customers come back? | Week 1 and week 4 retention | Change onboarding or follow-up |
| Does live chat help sales? | Chatted vs not-chatted conversion | Staff chat hours or not |
| Which pages lose people? | Bounce and exit by page and source | Rewrite or retarget the page |
| Did the release break anything? | Error rate and Web Vitals before and after | Roll back or hotfix |
| Who is slipping away? | Recency and frequency groups | Send a win-back to the right group |
| Is the market growing faster? | Own growth vs outside benchmark | Invest more or hold |
Each row should also carry a threshold written before looking at the data.
Worked example: which channels pay back?
Sample data: one month for an online store with three channels. Cost per session is spend ÷ sessions, cost per acquisition is spend ÷ purchases, and return on ad spend is revenue ÷ spend.
| Channel | Spend | Sessions | Purchases | Revenue | Cost per session | Cost per acquisition | Return on ad spend |
|---|---|---|---|---|---|---|---|
| Search ads | $6,000 | 4,000 | 120 | $9,600 | $1.50 | $50.00 | 1.60 |
| Social ads | $4,000 | 5,000 | 50 | $3,000 | $0.80 | $80.00 | 0.75 |
| $500 | 2,000 | 90 | $7,200 | $0.25 | $5.56 | 14.40 | |
| Total | $10,500 | 11,000 | 260 | $19,800 | $0.95 | $40.38 | 1.89 |
Two things stand out. Social has the cheapest sessions ($0.80) and the worst acquisition cost ($80.00), because only 50 ÷ 5,000 = 1.0% of its sessions purchase, against 3.0% for search and 4.5% for email. Cheap clicks are not cheap customers.
Second, revenue is not profit. If gross margin is 40%, a channel needs return on ad spend of at least 1 ÷ 0.40 = 2.5 to break even. Search at 1.60 earns $9,600 × 0.40 = $3,840 gross profit on $6,000 spend, a $2,160 loss before overheads; social loses $4,000 − $1,200 = $2,800; email earns $7,200 × 0.40 = $2,880 on $500.
The decision is not "cut everything below 2.5". Email is capped by the size of the list, search may be bringing buyers whom email later converts, and the landing page may be the real problem. The decision is: test lower social spend with a better landing page, check search by keyword, and attribute across touchpoints before judging a channel on last-click revenue alone.
Return on ad spend by channel
sample online store, one monthHow do you find where buyers drop out?
Question 2 asks for conversion between ordered steps. For a store, the funnel might be cart, checkout, shipping, payment, order. The benchmark outside your data is Baymard Institute's documented cart abandonment average of 70.22% across 50 studies; if your cart-to-order rate is 31.5%, you abandon 68.5%, which is in line, and the interesting number is the weakest step, not the total. The worked funnel and the patterns behind each drop are in bad UX examples.
The decision rule: fix the step with the lowest conversion that has the most people entering it. A 60% step with 7,000 entries is worth more attention than a 40% step with 200.
Do new customers come back?
Retention answers whether the people you acquired stay. Define the cohort (people who first purchased in a given week), define the return event (another purchase, a login) and count how many return in week 1 and week 4. Suppose 1,000 first-time buyers produce 220 returning in week 1 (22.0%) and 130 in week 4 (13.0%). If a change to the first follow-up email lifts week 4 to 15.0% for the next 1,000 buyers, that is 20 extra returning customers per cohort. The decision is where to spend effort: onboarding and the first message, or acquisition.
Does live chat help sales, and how would you know?
Chat is a cost (people, hours), so the question is what it adds. The metric is goal conversion for visitors who chatted against visitors who did not. Raw gaps overstate the effect because people who chat are often already closer to buying, so treat it as an upper bound and compare like with like. Suppose 300 chatted visitors convert at 12.0% and 9,700 others at 3.0%: the relative lift is 12.0 ÷ 3.0 − 1 = 300%, which is almost certainly inflated. A matched baseline (non-chatters who viewed the same pages) of 6.0% would give 12.0 ÷ 6.0 − 1 = 100%. The decision: whether to extend chat hours on the pages where chat starts. Live chat lead generation covers the chat side.
Which of the remaining questions need an outside number?
Questions 5, 6 and 7 are internal: compare pages, compare before and after a release, compare groups of customers. Question 8 needs an external reference, because your own growth only means something relative to the market.
The US Census Bureau's Quarterly Retail E-Commerce report is the standard public benchmark: for the third quarter of 2026 it estimates retail e-commerce sales at $347.3 billion, or 17.9% of total retail sales of $1,941.9 billion, seasonally adjusted, and says e-commerce rose 1.6% from the previous quarter while total retail rose 1.1%. If your online sales grew 0.5% in the quarter, you are growing slower than the market and the decision is about share, not about whether the month looked fine. Use the Census figure as context, not as a target: it covers all US retail, and your category may behave differently.
How do you write your own question-metric-decision example?
Use this template in a planning document before building a report:
- Question, in the words of the person who will act on it ("Should we keep paying for social ads?").
- Metric, with its formula and the system it comes from ("revenue ÷ spend by channel, same month").
- Threshold, written before you look ("below 2.5 at 40% margin means reduce").
- Decision and owner, a named person and a date.
- Check, when you will look again to see if the decision worked.
A report with no threshold and no owner produces discussion rather than action. Writing the threshold first also protects you from picking the number after you have seen it.
What mistakes turn analytics examples into bad decisions?
- Judging channels on revenue instead of margin. In the sample, search shows $9,600 of revenue and still loses $2,160 at a 40% margin.
- Reading a ratio without its size. A 60% step conversion matters in proportion to the people entering it; weigh rate by volume.
- Using the raw chatted-vs-not gap as the effect. It is an upper bound until you compare like with like.
- Comparing periods that differ. A holiday week against a normal week measures the calendar, not your change. Compare the same weekdays or the same period last year.
- Picking the threshold after seeing the number. Write it down first, as in the template above.
- Acting on tiny groups. A cohort of 40 people moves 10 points on four purchases; wait for a few hundred before changing a process.
How do you run these examples in TapCub?
Take the channel example. In TapCub:
- Import spend. In All-platform analytics › Business › Channel ROI, import spend by day, channel, source or campaign as a CSV or one row at a time.
- Read the three numbers. The page shows cost per click (spend ÷ sessions), cost per acquisition (spend ÷ purchases from orders) and return on ad spend, grouped by channel, source or campaign.
- Compare attribution models side by side. In All-platform analytics › Behavior › Behavior analysis, pick first-touch, last-touch, linear, position-based and time-decay together; each is a column, so a channel that mostly assists is visible.
- Do the funnel and retention questions. The same page builds funnels and retention for examples 2 and 3.
- Do the chat question. In Live chat › Reports › Conversion attribution, compare goal conversion for visitors who chatted and those who did not; it warns when fewer than 30 chatted and lists the pages where chats start.
TapCub does not buy or optimise ads and does not run experiments; it measures what each channel returned and leaves the decision to you.
FAQ
What are some examples of business analytics?
Channel return on ad spend, funnel conversion by step, customer retention by cohort, chat versus non-chat conversion, bounce by page and source, error rate after a release, recency and frequency groups, and online sales growth against a market benchmark. Each is a question, a metric and a decision.
What are the four types of business analytics?
Commonly described as descriptive (what happened), diagnostic (why), predictive (what will happen) and prescriptive (what to do). This page's examples are mostly descriptive and diagnostic, and each ends with a decision, which is the prescriptive step done by a person.
How do you choose which metric to use?
Start from the decision, not the dashboard: what would you do differently if the number were high or low? If you cannot say, drop the metric. Then write the formula and a threshold before looking at the data.
Is return on ad spend the same as profit?
No. It is revenue ÷ spend. At a 40% gross margin a channel needs a return of at least 2.5 to cover spend, so 1.60 in the sample loses money even though revenue exceeds spend.
How often should you review business analytics?
Match the review to how fast the decision can change: weekly for channels and funnels, after each release for errors and speed, monthly for retention and customer groups, quarterly for market benchmarks.
Sources
- U.S. Census Bureau. Quarterly Retail E-Commerce Sales — Q3 2026: $347.3 billion, 17.9% of total retail sales, released 19 November 2026. Verified 2026-11-20.
- Baymard Institute. Cart Abandonment Rate Statistics — 70.22% average across 50 studies. Verified 2026-11-20.
Was this article helpful?
We use your answers to fix and expand this page.
Couldn’t send. Please try again in a minute.
Thanks for the feedback. We’ll use it to improve this page.You’ve already sent feedback on this page. Thanks.

Data Analyst
Explores traffic sources, conversion funnels, and retention, using clear metric definitions and concrete examples to explain what the numbers mean.