Try it on your own data
Every report in this article is in the free plan. One snippet for web and apps, up to 10 sites.
Start freeA business metric is a number computed the same way every time, over a stated period, to show how part of the business is doing. Choose them in three tiers: one north star that says whether customers get value, three to five inputs the team can move, and two to four guardrails that must not get worse. Below: the six-part definition, the five types, a worked example and how to set it up in TapCub.
What you will learn
- A metric needs a written definition: name, formula, unit, window, population and source; the denominator alone changed churn from 8.0% to 7.7%
- Organise metrics as north star, inputs and guardrails; in the example +25% signups hid 16.7% fewer paying accounts until a guardrail was added
- Keep under ten per team and retire any metric that no longer changes a decision
What are metrics in business?
A business metric is a number computed the same way every time, over a stated period, to show how some part of the business is doing. Revenue is a metric. "Business is good" is not, because nobody can compute it. What makes a number a metric is a written definition, and a definition has six parts:
| Part | What it settles | Example: weekly active accounts |
|---|---|---|
| Name | What everyone calls it | Weekly active accounts |
| Formula | The calculation | Distinct accounts with at least one key action |
| Unit | What is counted | Accounts, not users |
| Window | The period measured | Seven days ending Sunday |
| Population | Who is in or out | Paying accounts; internal test accounts excluded |
| Source | Where the data comes from | Product events, deduplicated by account ID |
A metric becomes a KPI when you attach a target and an owner; that distinction is covered in metrics vs KPIs. This guide is about choosing which metrics to have in the first place.
How to organise business metrics: north star, inputs, guardrails
Hundreds of numbers can be measured. A small structure keeps the list useful by giving each metric a job.
| Tier | Job | How many | Example |
|---|---|---|---|
| North star | The one number that says whether customers are getting value | 1 | Weekly active accounts |
| Inputs | The levers the team can move to push the north star | 3–5 | Signup-to-activation rate, invites sent per account |
| Guardrails | Numbers that must not get worse while you push the others | 2–4 | Refund rate, page error rate, support contacts per 100 accounts |
The structure answers three different questions. The north star says where you are heading. Inputs say what to work on this quarter. Guardrails say what you are not allowed to break on the way. A single metric cannot answer all three; a team given only a north star will optimise it at any cost. How the inputs connect to the north star is the subject of metric trees, and the idea itself is explained in north star metric.
| Tier | Job | How many |
|---|---|---|
| North star | The one number that says customers are getting value | 1 |
| Inputs | Levers the team can move to push the north star | 3–5 |
| Guardrails | Numbers that must not get worse while you push the others | 2–4 |
A working rule, not a standard: under ten numbers per team.
The main types of business metrics
Most metrics fall into five groups. The group tells you which question the metric answers and who usually owns it.
| Group | Question | Examples | Usual owner |
|---|---|---|---|
| Financial | Are we making money? | Revenue, gross margin, cash runway | Finance |
| Customer | Are customers staying and satisfied? | Retention rate, support satisfaction, repeat purchase rate | Success or support |
| Product | Do people use what we built? | Active users, activation rate, feature adoption | Product |
| Acquisition | Is demand arriving at a sensible cost? | Visitors, conversion rate, cost per signup | Marketing |
| Operational | Is the work done well and fast? | Delivery time, first response time, error rate | Operations or engineering |
A healthy set takes its north star from one group, its inputs from the group that drives it, and its guardrails from a different group. In the example later, the north star is a product metric, the inputs are acquisition and product metrics, and the guardrails come from customer and operational groups. For a deeper look at one group, see analytics metrics.
How to define a metric so two people get the same number
The most common metric failure is not a wrong number but two right numbers. Take a subscription business that starts a month with 500 customers.
Sample data: 40 customers cancel and 60 join, so it ends with 520.
- Finance divides cancellations by customers at the start: 40 ÷ 500 = 8.0%.
- Product divides by customers at the end: 40 ÷ 520 = 7.7%.
Both call it "churn rate." Both are correct. The meeting argues about whether churn improved when the only difference is the denominator. To avoid this, write four things into every definition:
- The denominator. Start of period, end of period or average. Pick one.
- The event. What counts, such as a cancellation or also a downgrade.
- The population. Whether trials, test accounts and refunded accounts are in.
- The time boundary. Calendar month, rolling thirty days or billing cycle.
Keep the definitions in one place everyone can read, and change a definition only with a dated note, so old and new numbers are never compared silently.
A worked example: a metric set for a subscription product
Sample data: a team sells a team-collaboration subscription.
| Tier | Metric | Definition | Current value |
|---|---|---|---|
| North star | Weekly active accounts | Paying accounts with at least one key action in 7 days | 1,200 |
| Input | Activation rate | Signups reaching the key action within 7 days ÷ signups | 40% |
| Input | Invites per active account | Invites sent ÷ weekly active accounts | 2.1 |
| Guardrail | 30-day paid conversion | Trials converting to paid within 30 days ÷ trial signups | 12% |
| Guardrail | Support contacts per 100 accounts | Contacts in the week ÷ weekly active accounts × 100 | 6 |
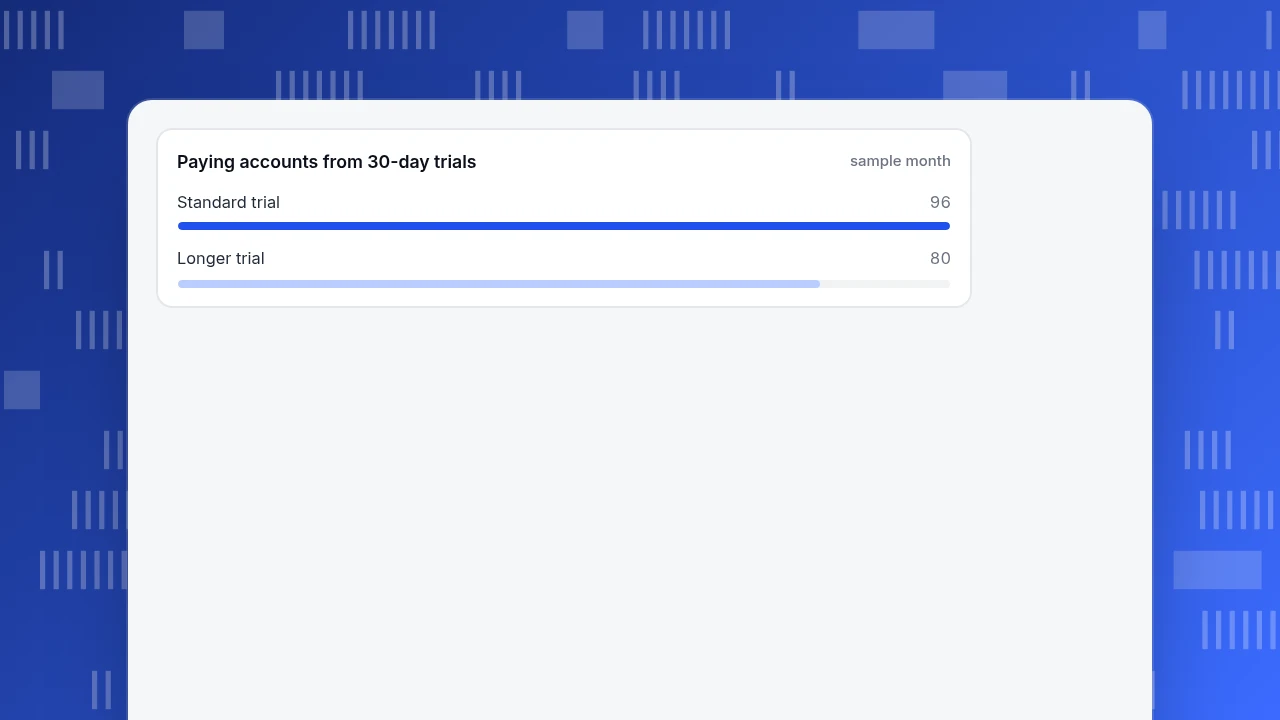
Now see why the guardrail matters. The team tries a longer free trial, and signups rise from 800 to 1,000 a month, an increase of 25%. Looking only at the input, that is a win. But 30-day paid conversion falls from 12% to 8%:
- Before: 800 × 12% = 96 paying accounts.
- After: 1,000 × 8% = 80 paying accounts.
- Change: 80 ÷ 96 − 1 = −16.7%.
The team got 25% more signups and 16.7% fewer customers. Without the guardrail, the dashboard would have shown only the first half. With it, the decision is clear: the trial change fails unless something else explains the drop.
The same logic applies to the other inputs. A campaign that doubles invites per account is only good if activation and support contacts hold steady; a rise from 6 to 9 support contacts per 100 accounts would be a 50% increase that the invites number would never reveal. Before shipping any change aimed at an input, write down which guardrail would tell you it went wrong, and the value at which you would reverse the change. Agreeing on that value in advance prevents the later argument about whether a drop is "bad enough".
Paying accounts from 30-day trials
sample monthHow many metrics should a business track?
Fewer than most teams think. A working rule is one north star, three to five inputs and two to four guardrails, so under ten numbers per team. Apply three tests to every candidate metric:
- The decision test. Name the decision this number changes. If there is none, it is a statistic, not a metric to manage.
- The owner test. Name the one person who answers for it. A metric everyone owns is owned by no one.
- The retirement test. Each quarter, drop any metric that did not change a decision. Keep it in a reference report if people still want to look.
Counting tells you what to measure; the framework tells you what to manage. The two lists are different, and the managed list is the short one.
Common mistakes with business metrics
- Choosing the easy number. Pageviews are easy to count and rarely show whether anyone got value.
- Optimising a metric until it stops meaning anything. Kerr's classic paper on rewarding one behaviour while hoping for another describes exactly this: people deliver what is measured. Pair every input with a guardrail.
- Mixing leading and lagging numbers in one view. Activation moves in a week; revenue retention moves in a year. Label which is which.
- Comparing numbers with different definitions. The churn example above shows how an 8.0% and a 7.7% can both be right.
- Reporting without a baseline. "1,200 weekly active accounts" needs last week's and last year's figure beside it.
- Never retiring a metric. The list only grows, and the north star gets lost.
How to set up business metrics in TapCub
Take the guardrail from the example: you want an alert when something that should not get worse does. Here is how that looks in TapCub.
- Define the metric once. In All-platform analytics › Behavior › Metrics & SQL, create a custom metric from a formula or from an event plus an aggregation: total count, unique users, per-user average or active share. Name it exactly as in your definition table.
- Use the built-in numbers. Pageviews, visitors, sessions, bounce rate, average duration, error rate and error count are available without any setup, so a guardrail such as page error rate needs no extra instrumentation.
- Put a guardrail on watch. In All-platform analytics › Operations › Monitors, choose a built-in metric or your saved metric and a check interval from hourly to monthly. A dry run calculates without sending and tells you how often the rule would have fired in the past 30 days.
- Look at the funnel behind an input. For an input such as activation rate, build the funnel in All-platform analytics › Behavior › Behavior analysis and compare the same step before and after a change.
- Know the boundary. Monitors notify; they do not change anything for you. Financial metrics such as margin and cash, and people metrics, live in your accounting and HR tools, not in TapCub.
FAQ
What are metrics in business?
Metrics are numbers computed the same way every time to show how part of a business is doing. A usable metric has a written definition: name, formula, unit, time window, population and data source. Revenue, retention rate and first response time are metrics; "customer happiness" is not until you define how it is measured.
What are the main types of business metrics?
Financial, customer, product, acquisition and operational. Each group answers a different question: are we making money, are customers staying, are people using the product, is demand arriving at a sensible cost, is the work done well. A balanced set draws from more than one group.
What is the difference between a metric and a KPI?
A metric is any measured number. A KPI is a metric with a target, an owner and a decision attached, chosen because it matters to a goal. Every KPI is a metric; most metrics are not KPIs.
How do you define a metric?
Write the name, the formula, the unit, the time window, who is in and out, and the data source. Settle the denominator, since dividing by customers at the start or end of a period gave 8.0% and 7.7% in the example above. Store it where everyone can read it.
How many business metrics should you track?
Fewer than ten per team is a workable limit: one north star, three to five inputs and two to four guardrails. Add a metric only when you can name the decision it changes and the person who answers for it, and retire any metric that went a quarter without changing a decision.
See also: Business Analytics Examples: 8 Questions and the Data That Answers Them.
Sources
- Kerry Rodden, Hilary Hutchinson & Xin Fu. Measuring the User Experience on a Large Scale: User-Centered Metrics for Web Applications. Google, CHI 2010 — the HEART framework and a process for mapping goals to metrics. Verified 2026-11-19.
- Steven Kerr. On the folly of rewarding A, while hoping for B. Academy of Management Journal 18(4), 1975 — why measured behaviour is what you get. Verified 2026-11-19 (DOI link returns 403 to scripts).
Was this article helpful?
We use your answers to fix and expand this page.
Couldn’t send. Please try again in a minute.
Thanks for the feedback. We’ll use it to improve this page.You’ve already sent feedback on this page. Thanks.

Data Engineer
Writes about event design, data quality, and collection workflows, with verifiable implementation methods for reliable analytics.