Try it on your own data
Every report in this article is in the free plan. One snippet for web and apps, up to 10 sites.
Start freeA business report gives one defined reader the information and judgement they need to decide or stay informed. Write it by audience and give management the conclusion first: a board needs the result against plan and the decision requested, a manager needs the cause and the next action. Below: seven report types, who needs what, a six-part structure, a worked quarter with a board and a manager version, and how TapCub supplies the web figures.
What you will learn
- Name the reader and the question before writing; the first line, length and numbers all follow from them
- Put the conclusion and the decision requested at the top, with five numbers or fewer on page one, each with a comparison
- The same quarter becomes a one-paragraph board report and a manager report with causes and owners; do not merge them
What is a business report?
A business report is a document that gives a defined reader the information and judgement they need to make a decision or stay informed about part of the business. The part that separates a report from a data export is the word "defined". A report has one named reader and one question, and it is shaped around them: its length, its first line and the numbers it contains all follow from who is reading and what they must decide.
That gives the rule this guide builds on: write business reports by audience, and give management the conclusion first. A board member, a department manager and the team doing the work need different reports even when they look at the same figures. A report that tries to serve all three serves none.
The structure of a recurring analytics write-up is covered in data analysis report, and the specifics of a website report are in web analytics report. This guide covers the wider field: the kinds of business report, how to match each to its reader, and a template you can adapt.
Types of business reports
Most business reports fall into seven kinds. Each answers a different question for a different reader.
| Type | Question it answers | Typical reader | Usual cadence | Typical length |
|---|---|---|---|---|
| Status or progress | Are we on track? | Project sponsor, manager | Weekly or fortnightly | One page |
| Performance | How did the numbers compare with plan? | Department lead, executive | Monthly or quarterly | One to three pages |
| Financial | What did we earn, spend and hold? | Executives, board, investors | Monthly, quarterly, annual | Statement plus commentary |
| Analytical | What does the evidence imply, and what should we do? | Decision-maker | When a decision arises | Two to eight pages |
| Project close-out | What did we deliver, what did it cost, what did we learn? | Sponsor | Once per project | Two to five pages |
| Compliance | Did we meet the rule or standard? | Regulator, auditor, risk lead | As required | As specified |
| Sales or marketing | What did the pipeline or campaign produce? | Sales and marketing leads | Weekly or monthly | One to two pages |
If you are not sure which kind you are writing, state the question at the top in one line. Many weak reports are two types stitched together: a status report that is also trying to be a post-mortem.
Write for the reader: who needs what
The same quarter becomes four different reports depending on who reads it.
| Reader | What they need | How much they read | First line should be |
|---|---|---|---|
| Board | Whether the business is healthy and what to approve | A page, then questions | The result against plan and the decision requested |
| Executive team | Where to act, and what it costs | One to two pages | The conclusion and the three numbers behind it |
| Department manager | Why it moved and what to change | Two to three pages | The main cause and the first action |
| Working team | Details, owners and dates | The whole thing | What changed this week and who is on it |
Two habits help. First, write the first line for the most senior reader, then let detail grow beneath it for the readers who need it. Second, put the decision at the top: if you need approval, say what and by when before explaining why. Nielsen Norman Group's research on how people read online found they scan and rarely read word by word, which is why a conclusion buried in paragraph six is usually never seen.
| Reader | What they need | First line should be |
|---|---|---|
| Board | Whether the business is healthy and what to approve | The result against plan and the decision requested |
| Executive team | Where to act, and what it costs | The conclusion and the three numbers behind it |
| Department manager | Why it moved and what to change | The main cause and the first action |
| Working team | Details, owners and dates | What changed this week and who is on it |
Write the first line for the most senior reader; let detail grow below it.
The structure of a business report
Use this order, dropping sections the reader does not need.
- Executive summary. The conclusion, the key numbers and the decision requested, in three to five lines. Write it last, put it first.
- Background. Only what the reader does not already know. Often one sentence.
- Findings. The evidence, grouped by theme, each with a number and a comparison.
- Recommendations or decisions. What should happen, who owns it, by when and at what cost.
- Risks and caveats. What could make the conclusion wrong, and what you are unsure about.
- Appendix. Tables, method and anything that supports a claim but would slow the reader.
A report is easier to scan when each finding sits under a heading that states the result, such as "Gross margin fell 2 points because of discounts", not a topic label such as "Margin". The same advice appears in the US Securities and Exchange Commission's plain English handbook for company disclosures: short sentences, active voice, everyday words.
A worked example: one quarter, two reports
Sample data: a company's quarter. Revenue was $1,200,000 against a plan of $1,250,000 and $1,000,000 in the same quarter last year. Gross margin was 58.0% against a plan of 60.0%. There were 480 customers against a plan of 500.
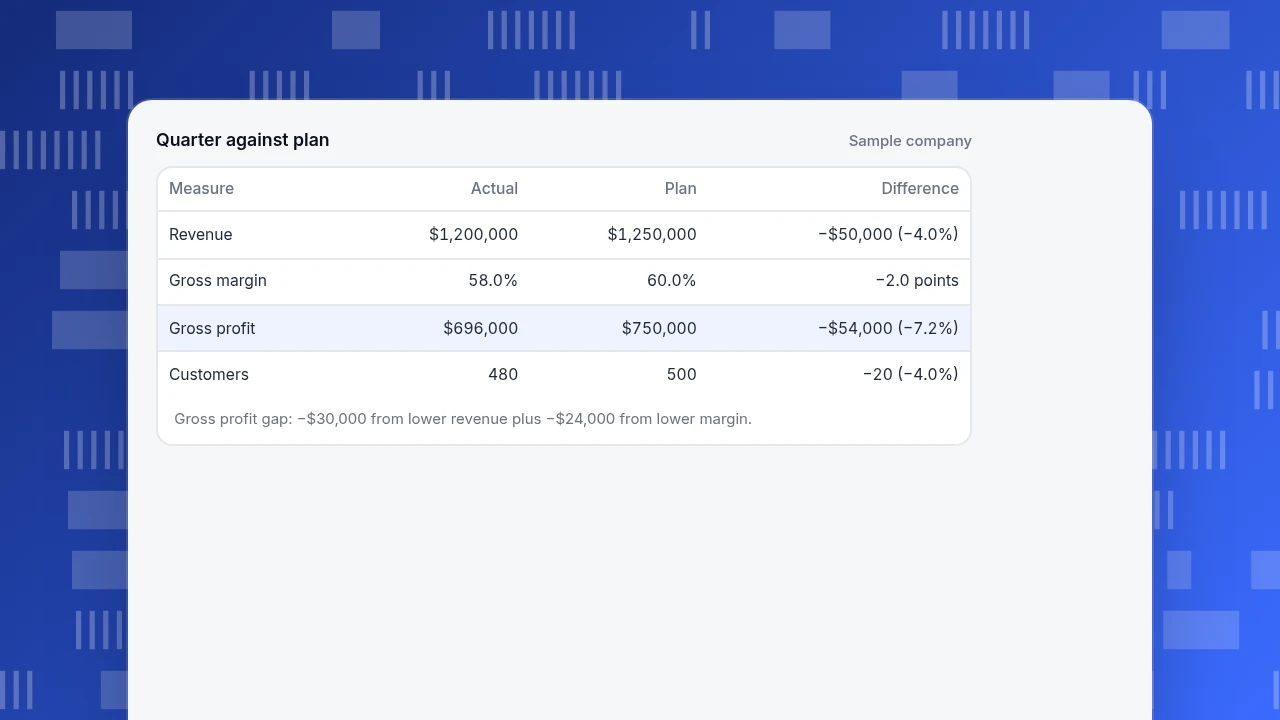
The numbers behind the report:
| Measure | Actual | Plan | Difference |
|---|---|---|---|
| Revenue | $1,200,000 | $1,250,000 | −$50,000 (−4.0%) |
| Gross margin | 58.0% | 60.0% | −2.0 points |
| Gross profit | $696,000 | $750,000 | −$54,000 (−7.2%) |
| Customers | 480 | 500 | −20 (−4.0%) |
Gross profit is revenue × margin: 1,200,000 × 58.0% = $696,000, and 1,250,000 × 60.0% = $750,000. The $54,000 shortfall splits into two causes:
- Volume. Revenue was $50,000 short, at the planned margin: −50,000 × 60.0% = −$30,000.
- Margin. Margin was 2 points lower on actual revenue: 1,200,000 × (58.0% − 60.0%) = −$24,000.
30,000 + 24,000 = 54,000, so the two causes explain the whole gap. Revenue is also 20.0% above the same quarter last year (1,200,000 ÷ 1,000,000 − 1), so "behind plan" and "growing" are both true.
The board version (one paragraph)
Revenue was $1.20 million, 4.0% below plan and 20.0% above last year. Gross profit was $54,000 below plan: $30,000 from lower revenue and $24,000 from margin falling to 58.0% (plan 60.0%). We ask the board to approve a discount cap of 10% from next month. Risk: if the cap slows sales, revenue falls further.
The manager version (adds the why and the what-next)
- Customers were 480 against 500, which explains the revenue shortfall at an average of $2,500 each (1,200,000 ÷ 480).
- Margin loss is concentrated in discounted deals; list each deal over a set discount with its owner.
- Action list with owners and dates for the discount review and the pipeline gap.
The facts are the same. The board version asks for one decision; the manager version tells people what to do on Monday.
Quarter against plan
Sample company| Measure | Actual | Plan | Difference |
|---|---|---|---|
| Revenue | $1,200,000 | $1,250,000 | −$50,000 (−4.0%) |
| Gross margin | 58.0% | 60.0% | −2.0 points |
| Gross profit | $696,000 | $750,000 | −$54,000 (−7.2%) |
| Customers | 480 | 500 | −20 (−4.0%) |
Gross profit gap: −$30,000 from lower revenue plus −$24,000 from lower margin.
Length, format and status colours
Keep to a few rules and the report stays readable.
- Five numbers on page one. More than that and none stands out. Move the rest to the appendix.
- Every number has a comparison. Plan, prior period or prior year, stated each time.
- Use status colours with written rules. For example green at 98% of plan or better, amber from 90% to under 98%, red under 90%. In the example, revenue at 96.0% of plan is amber and gross profit at 92.8% is amber, and the thresholds are visible to the reader.
- One chart per message. Add a chart only when it shows the comparison the sentence claims.
- Fixed template for recurring reports. The reader learns where to look.
Common mistakes in business reports
- Opening with background. The board's first question is "so what", not "how did we get here".
- Writing for yourself. Detail the writer finds interesting but the reader cannot act on belongs in the appendix.
- No decision requested. A report that asks for nothing is easy to postpone.
- Numbers without comparison. $1,200,000 means nothing without the plan.
- Hiding bad news low in the document. Readers who find it themselves stop trusting the rest.
- Mixing the types. A status update, an analysis and a financial statement need different structures; merge them and each does its job badly.
How TapCub helps with business reports
TapCub covers the website, app and chat numbers that go into a report, not the financial statements. If the quarter above included a web store, this is how the web section would be produced.
- Build the table. In Web analytics › Reports, choose columns such as visitors, conversion rate and revenue, set the bucket to month, and turn on Show change to compare with the previous period. The column choice is saved in the link.
- Hand it over read-only. In Configuration › Settings › Public sharing, create a read-only link, add a password if needed, choose the modules to open (overview, pages, sources, audience, bots) and limit how many days of data can be seen. Visitor lists and sessions cannot be shared.
- Mark known events. Add dates for a release, campaign or price change in Configuration › Annotations so readers of the chart see the cause.
- Schedule it. Click Subscribe on the report; it opens the project's notification settings, where daily or weekly delivery is configured.
- Know the boundary. TapCub provides the web, app and chat figures. It does not write the executive summary, hold your financial statements or produce the recommendation, and the report's argument stays with the person who knows the business.
FAQ
What is a business report?
A document that gives a defined reader the information and judgement they need to decide or stay informed about part of the business. It is shaped by who reads it and what they must decide: length, first line and numbers all follow from that.
What are the types of business reports?
Status or progress, performance, financial, analytical, project close-out, compliance, and sales or marketing reports. Each answers a different question for a different reader, so state the question at the top.
How do you write a business report?
Name the reader and the decision, open with an executive summary of the conclusion and the decision requested, support it with a few numbers that each have a comparison, list recommendations with owners and dates, add risks, and put detail in an appendix.
How long should a business report be?
As short as the reader's decision allows: one page for a board or sponsor update, one to three pages for managers and executives, longer only for analytical reports where the evidence needs space. Put supporting detail in an appendix.
Sources
- Nielsen Norman Group. Inverted Pyramids in Cyberspace — putting the conclusion first for scanning readers. Verified 2026-11-19.
- Nielsen Norman Group. How Users Read on the Web — people scan rather than read word by word. Verified 2026-11-19.
- US Securities and Exchange Commission. A Plain English Handbook — short sentences, active voice and everyday words in business documents. Verified 2026-11-19 (link returns 403 to scripts).
Was this article helpful?
We use your answers to fix and expand this page.
Couldn’t send. Please try again in a minute.
Thanks for the feedback. We’ll use it to improve this page.You’ve already sent feedback on this page. Thanks.

Product Experience Specialist
Writes about product experience, practical workflows, and growth, turning complex processes into clear steps for everyday decisions.