Try it on your own data
Every report in this article is in the free plan. One snippet for web and apps, up to 10 sites.
Start freeChoose business analytics software on four criteria: can it reach the data you have, can you define a metric once and trust it, how do people share and control it, and what does it cost over three years including upkeep. Below is a recomputable cost table and a scorecard whose winner flips when the weights change.
What you will learn
- List your five key data sources and mark how each connects before any demo
- Count upkeep hours in a three-year cost; a free licence is not a free tool
- Fix the scoring weights before you see the demos, because the ranking can flip
What is business analytics software, and how is it different from BI and web analytics?
Business analytics software takes data from the systems a company runs on, lets people define measures, and turns them into reports, dashboards and sometimes forecasts. The category is blurry because three kinds of tools overlap, and they answer different questions:
| Kind of tool | The question it answers | Typical data | Typical user |
|---|---|---|---|
| Business intelligence (BI) | What happened, across the business? | Databases, spreadsheets, finance and CRM exports | Analysts, managers |
| Business analytics | Why did it happen, and what next? | The same, plus models and forecasts | Analysts, data teams |
| Web and product analytics | What do visitors and users do? | Events from a site or app | Marketers, product teams |
In practice many products do two of the three. That is why a feature list is a poor way to choose, and why this article uses four criteria instead: data connection, modeling, collaboration and cost. The next four sections take them in turn, then score three anonymous options with sample numbers. For the BI-versus-analytics distinction see BI vs data analytics; for platforms that sit between the two, see data analytics platforms; for the website and product side, see web analytics tools.
Criterion 1: can it reach the data you actually have?
Most failed rollouts fail here, because the tool cannot see the data that matters. Do this before any demo: write down the five sources your decisions depend on and mark how each one connects.
| Source | Example | Questions to ask |
|---|---|---|
| Operational database | Orders, accounts | Direct connection or export? How often does it refresh? |
| Finance or billing | Invoices, subscriptions | Does it read the system or a monthly file? |
| Customer system | Contacts, deals | Native connector, or API work you will maintain? |
| Website and app | Visits, events | Can events be loaded, and with what identity? |
| Spreadsheets | Targets, budgets | Can people upload, and does an upload overwrite or append? |
Score the connection on three things: whether it is native (a supported connector), how fresh it is (live, hourly, daily) and who maintains it. A source that needs a custom script is not a feature; it is a job. If three of your five sources need scripts, the tool is cheap only on the price list.
Criterion 2: can you define a metric once and trust it everywhere?
Modeling is where numbers stop being arguments. The test is concrete: take one definition your company disputes, such as "active customer", and check whether you can define it once, reuse it in every report and see where it is used.
Look for:
- One place for definitions. A saved metric that charts reference, not a formula copied into each chart.
- Calculated fields and a query option. Business users should get formulas; analysts need SQL for the cases the formulas cannot cover.
- Row-level detail and joins. You will want to join orders with campaigns and see what sits behind a number.
- A change history. When a definition changes, you should know which reports moved.
A quick check of the cost of getting this wrong: a "revenue" tile defined in three reports in three slightly different ways produces three numbers on one meeting table, and the first 20 minutes go on which is right.
Criterion 3: how do people share, control and schedule?
A tool nobody else can read is a notebook. Check collaboration across four things:
| Need | What good looks like | Red flag |
|---|---|---|
| Access control | Roles, and the ability to hide sensitive fields | Everyone sees everything or nothing |
| Sharing | Read-only links, optional password, expiry | Sharing means exporting a screenshot |
| Delivery | Scheduled reports by email or chat | Someone must log in to look |
| Accountability | An owner and a last-updated date per dashboard | Orphaned dashboards nobody maintains |
The criterion that matters most is the one your organisation will actually use. A small team may need nothing more than shared read-only links and a weekly email; a larger one will need roles and an audit trail. Do not pay for the second when you only need the first.
Criterion 4: what does it cost over three years, not per month?
The price list is the smallest part of the bill. Total cost of ownership adds the licence, the setup, the upkeep (updating connectors, fixing broken reports, training) and any infrastructure you run yourself.
Sample data: 25 users, a three-year view, labour at $75 an hour. The three options are anonymous types, not products.
| Item (3 years) | A: cloud BI for analysts | B: enterprise suite | C: self-hosted open source |
|---|---|---|---|
| Licence | $20 × 25 × 12 × 3 = $18,000 | $60 × 25 × 12 × 3 = $54,000 | $0 |
| Setup | 40 h × $75 = $3,000 | 200 h × $75 = $15,000 | 120 h × $75 = $9,000 |
| Upkeep | 4 h/month × 36 × $75 = $10,800 | 8 h/month × 36 × $75 = $21,600 | 16 h/month × 36 × $75 = $43,200 |
| Infrastructure | included | included | $200 × 36 = $7,200 |
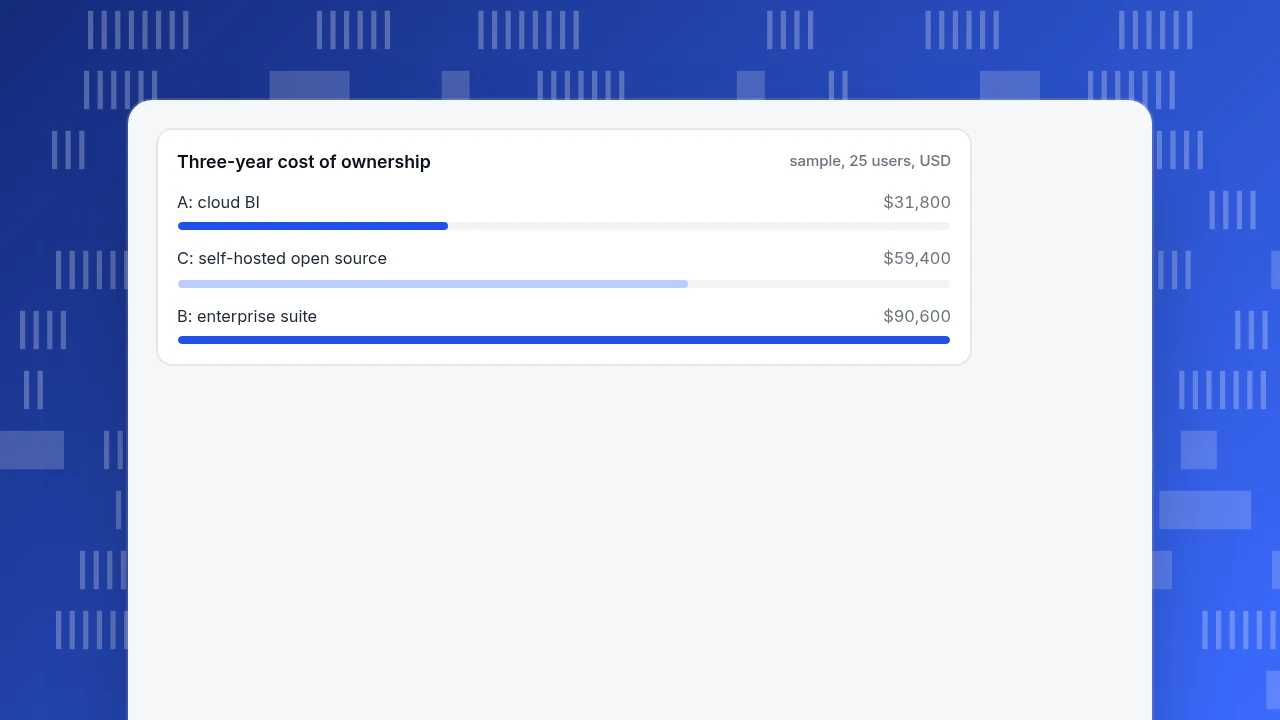
| Total | $31,800 | $90,600 | $59,400 |
Recomputed: A is 18,000 + 3,000 + 10,800 = 31,800; B is 54,000 + 15,000 + 21,600 = 90,600; C is 0 + 9,000 + 43,200 + 7,200 = 59,400. The option with no licence fee is not the cheapest, because upkeep is the largest line. The assumptions are yours to replace; the point is to put every hour of upkeep on the sheet.
| Criterion | What to test | Red flag |
|---|---|---|
| Data connection | Native connector, refresh rate, who maintains it | Three of five sources need custom scripts |
| Modeling | Define a disputed metric once and reuse it | Formula copied into every chart |
| Collaboration | Roles, read-only links, scheduled delivery | Sharing means a screenshot |
| Cost | Three-year total with upkeep | Only the price list is counted |
Weights are chosen before the demos.
How do you score the options with the four criteria?
Give each criterion a weight that adds to 100%, score every option from 1 to 5, and convert cost into a score by cost score = 5 × the cheapest total ÷ this option's total. For the example: A scores 5.00, B scores 5 × 31,800 ÷ 90,600 = 1.75, and C scores 5 × 31,800 ÷ 59,400 = 2.68.
Sample scores for the other three criteria, and two sets of weights:
| Option | Data | Modeling | Collaboration | Cost | Weighted (35 / 25 / 20 / 20) | Weighted (15 / 25 / 20 / 40) |
|---|---|---|---|---|---|---|
| A | 4 | 3 | 4 | 5.00 | 3.95 | 4.15 |
| B | 5 | 5 | 4 | 1.75 | 4.15 | 3.50 |
| C | 3 | 4 | 2 | 2.68 | 2.99 | 2.92 |
For B with the first weights: 5 × 0.35 + 5 × 0.25 + 4 × 0.20 + 1.75 × 0.20 = 1.75 + 1.25 + 0.80 + 0.35 = 4.15. With the second weights, A wins at 4.15 and B drops to 3.50. The ranking flips when the weights change, which is exactly why the weights belong in a meeting and not in a spreadsheet nobody reads. Decide them first, before you see the demos.
Three-year cost of ownership
sample, 25 users, USDHow do you run a two-week trial in five steps?
- Pick two real questions, each with a known answer from your current report.
- Connect your real data, not the demo dataset, and note how many hours the connection takes.
- Rebuild the two answers and one disputed definition, and check they match.
- Give three colleagues read access and ask them to find one number without help.
- Add up the hours and put them in the cost table.
If the tool cannot reproduce a number you already trust, stop; the problem is the data connection or the model, and a polished dashboard will not fix it.
Common mistakes when choosing business analytics software
- Choosing from the feature list. Features overlap; criteria separate.
- Judging on a demo dataset. The demo data is clean; yours is not.
- Ignoring upkeep. In the sample, upkeep was 34% of option A's cost and 73% of the self-hosted option's.
- Buying for the rare power user. Most people need to read and filter, not build.
- Weights chosen after the demos. The favourite wins and the matrix becomes theatre.
- Treating a web analytics tool as BI, or the reverse. They answer different questions from different data.
Where does TapCub fit in a business analytics stack?
TapCub is behavioural analytics for websites, apps and mini programs, plus live chat; it is not a general-purpose BI tool and does not connect to arbitrary databases or finance systems. Judged by the four criteria, here is what it covers for the website and product side.
- Data connection. Data arrives through one script on the website, SDKs for iOS, Android, Flutter, React Native and HarmonyOS, mini-program SDKs, and a server HTTP interface for events. All-platform analytics › Data › Data import also takes CSV events, CSV user properties and Nginx or Apache logs (up to 100,000 rows per file).
- Modeling. In All-platform analytics › Behavior › Metrics & SQL you define a metric once (a built-in, an event with an aggregation, or a formula) and reuse it across analyses; the SQL playground queries event data directly.
- Collaboration. Dashboards are under All-platform analytics › Overview › My dashboards; shares are read-only links with an optional password and show at most the last 90 days, and Configuration › Settings › Public sharing controls shared web modules. Saving analyses needs an analyst role or above; sharing needs an admin or the owner.
- Cost and scope. There is a free plan, and plan differences are covered in analytics vs chat plans. Revenue-side data such as finance and CRM stays in the systems you keep; use TapCub for the question it answers: what visitors and users do.
The practical pattern is to keep a BI tool for finance and operations and use TapCub where the data starts on your site or app. TapCub does not replace the BI layer.
FAQ
What is business analytics software?
Business analytics software connects to the data a company runs on, lets people define measures once, and presents them as reports, dashboards and sometimes forecasts. It overlaps with business intelligence tools and with web or product analytics, so choose by data connection, modeling, collaboration and cost.
What is the difference between business analytics and business intelligence software?
Business intelligence focuses on reporting what happened across the business. Business analytics usually goes further, into why it happened and what may happen next, with models and forecasts. Many products do both, so compare the criteria, not the category label.
How should I compare business analytics software?
Use four criteria with weights chosen before the demos: data connection, modeling, collaboration and three-year cost. Score each option from 1 to 5, convert cost to a score, and run a two-week trial on real data with two questions whose answers you already know.
Is open source business analytics software cheaper?
Not always. With no licence fee, the cost moves to setup, hosting and upkeep. In the sample, the self-hosted option cost $59,400 over three years against $31,800 for the cloud option, because upkeep was the largest line. Count every hour before deciding.
Does a small business need business analytics software?
Often a spreadsheet plus web analytics is enough until you have several data sources that need joining or several people arguing about definitions. Start with the question you cannot answer today and buy the smallest tool that answers it.
Sources
- Wikipedia. Business analytics — how business analytics relates to business intelligence and statistical methods. Verified 2026-11-19.
- Wikipedia. Business intelligence software — typical capabilities such as reporting, dashboards and data integration. Verified 2026-11-19.
- Wikipedia. Total cost of ownership — why acquisition price understates the cost of a system. Verified 2026-11-19.
Was this article helpful?
We use your answers to fix and expand this page.
Couldn’t send. Please try again in a minute.
Thanks for the feedback. We’ll use it to improve this page.You’ve already sent feedback on this page. Thanks.

Customer Experience Consultant
Writes about live chat, visitor conversations, and self-service, sharing practical ways to make customer communication clearer and more effective.