Try it on your own data
Every report in this article is in the free plan. One snippet for web and apps, up to 10 sites.
Start freeData analytics platforms come in four types, not one: web analytics, product analytics, business intelligence (BI) and data warehouses. Each answers a different question from a different data source, so choose by the questions you ask every week, not by feature lists. Most teams need two layers. Below: the four types, six screening questions, a counted example, when a warehouse is worth it and a decision table.
What you will learn
- Write down your recurring questions first; the platform type follows from them
- Collection tools answer behaviour questions; BI and warehouses matter when you must join data across systems
- Add a layer only when a weekly question cannot be answered by what you already have
What are the main types of data analytics platforms?
"Data analytics platform" is a label stretched over four different kinds of software. They overlap in marketing pages and barely overlap in practice, because each starts from a different question and a different source of data.
| Type | Question it answers | Where its data comes from | Who uses it daily |
|---|---|---|---|
| Web analytics | Who visits, from where, which pages and campaigns lead to goals? | A script on your site (page views, sources, events) | Marketers, content and growth teams |
| Product analytics | What do signed-in users do, where do they drop off, who comes back? | Events and user profiles sent from your app or site | Product managers, designers, growth |
| BI (business intelligence) | What do revenue, cost, support load or pipeline look like when combined? | Tables from databases, spreadsheets and business systems | Finance, operations, leadership |
| Data warehouse | Where do all raw data sets live so that anyone can query them together? | Loads from every other system, including exported events | Analysts and data engineers |
Vendors describe themselves in exactly these terms. Mixpanel's documentation describes product analytics as showing how people use a product by tracking their actions, the people behind them and the details attached. Microsoft describes Power BI as a business analytics platform that connects to many data sources and turns them into reports. Snowflake describes a cloud data platform that keeps storage and compute separate and queries data with SQL. Web analytics sits earlier in the chain: it is the script-based collection of visits and sources that the other three often consume.
The practical takeaway is that the four types are layers and neighbours, not rivals. A warehouse stores; BI reports over stored tables; product analytics and web analytics collect behaviour and answer behavioural questions without needing the first two.
Which six questions decide the choice?
Answer these before opening any vendor page. Each answer eliminates types.
- What is the recurring question? Write down the five questions someone asked in the last month. If they are about visits and campaigns, start with web analytics; about in-product behaviour, product analytics; about money across systems, BI.
- Who asks, and can they use a tool without help? If non-analysts must self-serve, prefer a tool with built-in reports over a warehouse that needs SQL.
- Where does the data already live? If it is in your own site and app, collection tools win. If it is spread across billing, CRM and support systems, you will need a warehouse or BI connectors.
- Do you need to join data from different systems? A join across systems (events plus billing plus support tickets) is the one thing collection tools do not do for you. That is the signal for a warehouse.
- How fresh must it be? Real-time views for a launch are a collection-tool feature. A daily-refreshed finance dashboard is fine for BI.
- What can you maintain? A warehouse needs loads, schemas and someone who fixes them. If nobody owns that, the project decays within a few months.
If question 4 is a firm "no", you probably do not need a warehouse yet.
What does a real question list look like?
Sample data: a ten-person subscription business writes down the ten questions its team asked in one quarter, then labels the type of platform that answers each one most directly.
| # | Question | Most direct type |
|---|---|---|
| 1 | Where did visitors come from this week? | Web analytics |
| 2 | Which landing pages bring sign-ups? | Web analytics |
| 3 | Did the new pricing page lift conversion? | Web analytics |
| 4 | Which onboarding step loses the most users? | Product analytics |
| 5 | Do users who adopt feature X come back more? | Product analytics |
| 6 | Which accounts are going quiet? | Product analytics |
| 7 | What is monthly revenue by plan, reconciled with finance? | BI |
| 8 | What does support cost per customer segment? | BI (needs support and billing tables) |
| 9 | What is revenue per channel against spend? | BI |
| 10 | Which product behaviours predict closed CRM deals? | Data warehouse |
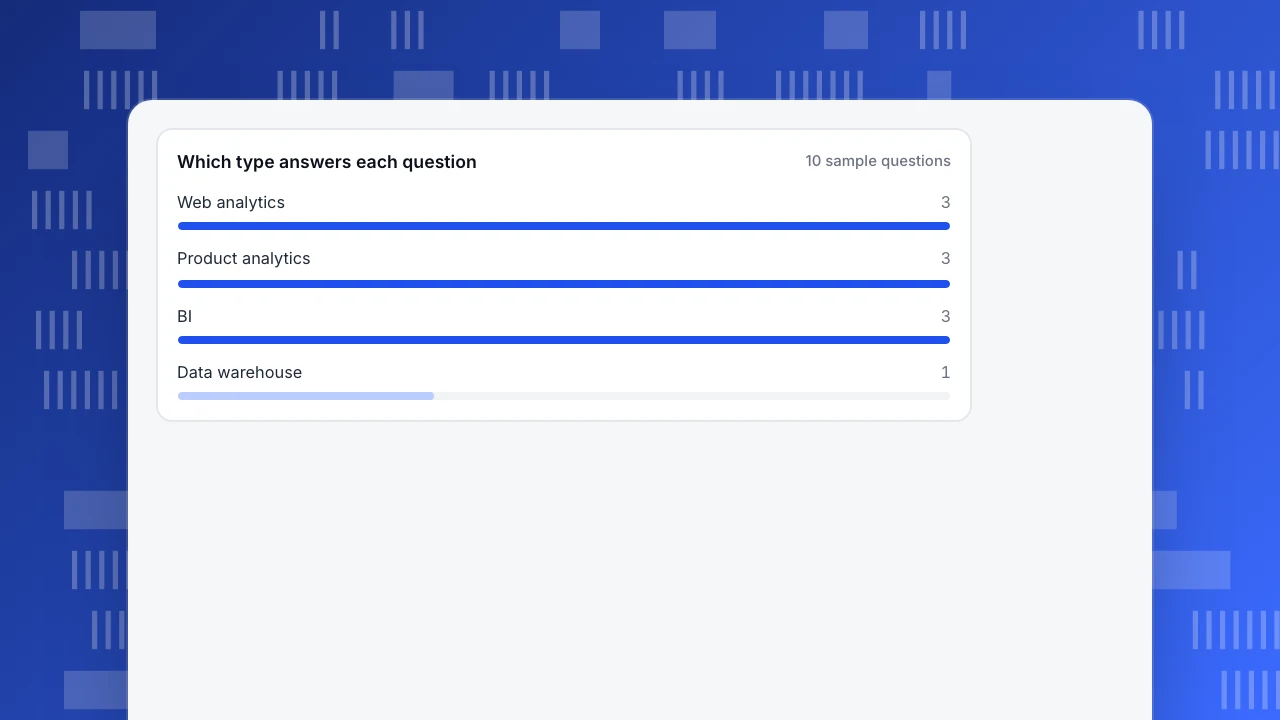
Counting: web analytics 3, product analytics 3, BI 3, warehouse 1, so each of the first three covers 30% and the warehouse 10%. Two collection tools together answer 6 of the 10 questions (60%) from one event stream. No single type answers more than 30%.
That is the thesis of this article in one table: no type is all-purpose, and a team usually needs two. Which two depends on where the count lands. This team starts with web and product analytics (60%) and adds BI when finance asks questions 7 to 9 weekly. Question 10 is the only one that would justify a warehouse, and it can wait.
Which type answers each question
10 sample questionsWhen do you actually need a data warehouse?
When a question needs a join that no collection tool can do, or when volume outgrows what a tool exports. Test with these thresholds:
- A join across systems (questions 8 and 10 above). If you only ever look at behaviour inside one tool, you do not need a warehouse.
- Raw-data volume. Google's documentation says standard Google Analytics 4 properties can export up to 1 million events a day to BigQuery. A site with 40,000 sessions a day and 25 events per session sends 40,000 × 25 = 1,000,000 events a day and sits at that limit. Check your own tool's export limits against your volume.
- Ownership. One person who can write SQL and fix a broken load. Without that, delay the warehouse.
- A reason to keep raw events beyond the tool's retention window, such as audits or model training.
The cost of buying early is real: loads, schemas and quality checks are ongoing work. The cost of buying late is milder if your collection tool offers raw export, but history from before the export started is not recovered, so turn export on early even if no one queries it yet.
What is the smallest stack that works?
Start from team size and number of data owners, not from vendor lists.
| Team | Stack | Why |
|---|---|---|
| 1 to 10 people, no analyst | One collection tool covering web and product behaviour, plus a spreadsheet for finance | Fewest moving parts; answers most behaviour questions |
| 10 to 50 people, one analyst | The same tool, plus BI on exported tables for finance and operations | Adds cross-system reporting only when someone asks weekly |
| 50+ people, data team | Collection tools, warehouse, BI on top | Joins and governance justify the maintenance cost |
Rule: add a layer only when a recurring question, asked weekly for a month, cannot be answered by what you have. A one-off question can be answered with an export and a spreadsheet.
What is a quick decision table?
| If your main need is... | Start with | Add later |
|---|---|---|
| Traffic, campaigns, content performance | Web analytics | Product analytics once there is sign-in |
| Activation, funnels, retention inside an app | Product analytics | BI for revenue reporting |
| Board reporting across revenue, cost and headcount | BI | A warehouse if the sources grow past a few |
| Joining events with CRM, billing or support | Warehouse (plus BI) | A collection tool feeding events into it |
| Privacy-limited, light setup | Web analytics with limited collection | Product analytics when needed |
| If your main need is... | Start with | Add later |
|---|---|---|
| Traffic, campaigns, content performance | Web analytics | Product analytics once there is sign-in |
| Activation, funnels, retention inside an app | Product analytics | BI for revenue reporting |
| Board reporting across revenue, cost and headcount | BI | A warehouse if sources grow past a few |
| Joining events with CRM, billing or support | Warehouse (plus BI) | A collection tool feeding events into it |
| Privacy-limited, light setup | Web analytics with limited collection | Product analytics when needed |
Start with the row that matches your most frequent question.
Which mistakes waste the most time?
- Buying a warehouse to answer a traffic question. A web-analytics report answers "where did visitors come from" in seconds; a warehouse needs weeks of setup first.
- Expecting one tool to be authoritative for revenue. Behavioural tools record what the site reported; finance records what the bank received. They will not match exactly. Reconcile revenue in BI, and use the behavioural tool for ratios and trends.
- Comparing platforms by feature count. Ten features you never use are not an advantage. Compare on the six questions above.
- Skipping naming discipline. Event names that differ between teams make every later join harder, whatever the platform. A tracking plan costs an hour and saves weeks.
- Never turning on raw export. The day you need it, the history is already gone.
- Treating the list as permanent. Review the question list every six months; the stack that suited ten questions may not suit thirty.
How does this look in TapCub?
Take the sample team above. Here is how its first six questions map to TapCub, and where it stops.
- Questions 1 to 3, web. In Web analytics › Sources, read visitors by channel and UTM; in Web analytics › Pages, see landing pages; in Web analytics › Goals, count a signup or event as a conversion. Recognised bots are counted separately, so crawlers do not inflate the visitor numbers.
- Questions 4 to 6, product behaviour. Open All-platform analytics › Behavior › Behavior analysis for funnels, retention and paths, and All-platform analytics › Users › People for a single user's timeline. A segment defined in All-platform analytics › Users › Segments & tags can be used across those analyses. For question 6 on accounts, All-platform analytics › Users › Accounts summarises accounts with a health score; it is an organisation view and does not open individual users.
- Custom numbers. All-platform analytics › Behavior › Metrics & SQL lets you define your own metric from events or query event data in SQL.
- Getting data out. All-platform analytics › Data › Data export creates an asynchronous export of raw detail (not a screenshot of a report), within the retention period. That is the bridge to a warehouse when question 10 arrives.
- Where TapCub stops. TapCub is not BI and not a warehouse. It does not join your finance, CRM or support tables, and All-platform analytics › Business › Commerce & revenue reports the orders you send to it, not a reconciled ledger. For questions 7 to 10, export events and use a BI tool or warehouse.
The same script also powers live chat, so a team that later adds support still has one visitor ID across both.
FAQ
What is a data analytics platform?
A data analytics platform is software that collects, stores or reports on data so people can answer business questions. The label covers four kinds: web analytics, product analytics, BI and data warehouses, each built for a different question and data source.
What is the difference between a data platform and a BI tool?
A data platform such as a warehouse stores and queries data from many systems. A BI tool connects to those tables and turns them into reports and dashboards. Many teams use both: the warehouse underneath, BI on top.
Do small businesses need a data warehouse?
Usually not at first. If your questions concern website and in-app behaviour, one collection tool answers most of them. Consider a warehouse when you must join events with billing, CRM or support data, and when someone can maintain it.
Can one platform do everything?
Rarely. In the sample question list above, no single type answered more than 30% of the questions. Choose two layers that cover your recurring questions rather than one tool that promises all four.
How do I choose between web analytics and product analytics?
If you mostly ask about visitors, sources and campaigns, start with web analytics. If you mostly ask what signed-in users do and who returns, start with product analytics. Many tools offer both from one event stream.
See also: Business Analytics Software: How to Choose With 4 Criteria and a Scorecard.
See also: Open Source BI: The Hidden Costs of Sources, Permissions and Operations.
Sources
- Google. GA4 BigQuery Export. Raw event export to BigQuery, including the 1 million events per day limit for standard properties. Verified 2026-11-18.
- Microsoft. What is Power BI?. Business analytics platform connecting to many data sources. Verified 2026-11-18.
- Snowflake. Key concepts and architecture. Cloud data platform with storage and compute separated. Verified 2026-11-18.
- Mixpanel. What is Mixpanel?. Product analytics as actions, people and properties. Verified 2026-11-18.
Was this article helpful?
We use your answers to fix and expand this page.
Couldn’t send. Please try again in a minute.
Thanks for the feedback. We’ll use it to improve this page.You’ve already sent feedback on this page. Thanks.

Customer Experience Consultant
Writes about live chat, visitor conversations, and self-service, sharing practical ways to make customer communication clearer and more effective.