Try it on your own data
Every report in this article is in the free plan. One snippet for web and apps, up to 10 sites.
Start freeUnified data means data from several sources can be read as one consistent set: the same person appears once and each field means the same thing everywhere. There are four common ways to get there, point-to-point links, ETL or ELT, a unified data layer and real-time streaming. Most small teams should unify events and identity first.
What you will learn
- Unified data needs both a shared identity (one person, one id) and a shared schema (same field names and units)
- Direct links between tools grow as n × (n − 1) ÷ 2: 28 links at eight tools, against eight through one shared layer
- Merging lists without de-duplication overstates the audience: 10,000 naive versus 7,500 unique in the example
What "unified data" means
Unified data means data from several sources can be read as one consistent set: the same person appears once, and the same field means the same thing everywhere. Two things have to be true for that to work. Identity: records from different systems that describe the same person or account are linked. Schema: fields are named, typed and measured the same way, so "revenue" from one system can be added to "revenue" from another.
The classic formulation, in Maurizio Lenzerini's survey of the theory, is a global schema that users query, a set of sources, and mappings that say how each source's data fits the global schema. Every practical approach below is a different way of building those mappings and deciding when the data moves. If you want the short vocabulary entry first, see data integration and unified data model.
This guide is about choosing between approaches, for a team that has data in several tools and wants to read it in one place. The ETL versus ELT detail is covered separately in ETL vs ELT, and the plumbing in data pipeline.
Four approaches compared
Sources describing integration list many techniques; SAP's overview names seven and notes that most organizations use more than one. For choosing, four families cover what a small or mid-sized team will actually meet.
| Approach | How it works | Fits when | Effort and cost | Freshness |
|---|---|---|---|---|
| Point-to-point | Each pair of tools is connected directly (a script, a native integration, a manual export) | Two or three tools, one or two reports | Cheap to start, grows fast, each link breaks on its own | Whatever each link does |
| ETL / ELT | Data is extracted from sources and copied in batches to a central store, transformed before (ETL) or after (ELT) loading | Many sources, history matters, one team owns the store | A store, a loader and someone maintaining the transformations | Hours to a day, depending on the schedule |
| Unified data layer | Sources are mapped onto one shared model (events plus identity), either written into one store or queried in place through a virtual layer | You want one definition of a user and one event vocabulary across tools | Design work up front, then low upkeep | Depends on the layer; often near real time for events |
| Real-time streaming | Events are captured as they happen and flow continuously to where they are used | Alerts, personalization or live dashboards need data within seconds | Highest: engineering for ordering, replays and failures | Seconds |
AWS defines ETL as gathering data from several sources into a central warehouse after cleaning and organizing it with business rules. Apache Kafka describes event streaming as capturing data in real time from event sources and keeping it for later use or forwarding it where needed. The freshness figures above are typical ranges, not measurements.
Why point-to-point breaks as you add tools
Point-to-point feels like the cheapest option because the first link is. The cost is in how the number of links grows. Connecting every one of n tools to every other needs n × (n − 1) ÷ 2 links, while routing all of them through one shared layer needs n.
| Tools | Direct links (n × (n − 1) ÷ 2) | Links through one layer (n) |
|---|---|---|
| 3 | 3 | 3 |
| 5 | 10 | 5 |
| 8 | 28 | 8 |
| 12 | 66 | 12 |
At three tools there is no difference, which is why point-to-point is a reasonable start. At eight tools you are maintaining 28 connections, each with its own field mapping, and a change in one tool can break several. The break-even is not a fixed number, but if you can name more than four or five sources, a shared layer starts to pay for itself.
Five questions to pick an approach
Answer these in order for your own situation. The rule beside each tells you what it implies.
| Question | Rule |
|---|---|
| How fresh must the number be? | If a day-old figure is fine, batch is enough. If someone acts on it within minutes (an alert, a live chat greeting), you need events flowing continuously. |
| How much data, and how much history? | Large volumes with years of history favour a central store loaded in batches. Small volumes rarely justify one. |
| How many sources, and will it grow? | Up to three or four stable sources, direct links can do. More than that, or a growing list, favours a shared model. |
| Who will maintain it? | A pipeline with nobody on call goes stale silently. If no one owns it, pick the approach with the fewest moving parts. |
| What happens if a feed breaks without anyone noticing? | If a wrong number would reach a customer or a budget decision, add a count check per source before you add another feed. |
For most small teams the answers point the same way: a handful of sources, daily freshness, nobody dedicated to pipelines. The most useful first investment is not a pipeline. It is a shared definition of an event and a shared identity for people, applied wherever the data is collected. That makes a later move to a warehouse far easier, and until then it already lets you read one set of numbers.
| Approach | Fits when | Freshness |
|---|---|---|
| Point-to-point | Two or three tools, one or two reports | Whatever each link does |
| ETL / ELT | Many sources, history matters, one team owns the store | Hours to a day |
| Unified data layer | One definition of a user and one event vocabulary across tools | Depends on the layer; often near real time for events |
| Real-time streaming | Alerts or live dashboards need data within seconds | Seconds |
Freshness figures are typical ranges, not measurements; most organizations combine more than one approach.
The smallest unified model that works
You do not need a large schema to start. Every record, from every source, needs these fields:
| Field | What it holds | Rule |
|---|---|---|
| person_id | Who it is about | One id per person across sources; keep the original source id too |
| event_name | What happened | A short, past-tense name from one agreed list, such as order_completed |
| occurred_at | When it happened | One time zone for everything, stored in UTC |
| source | Which system it came from | A fixed value per system, so you can count and trace |
| properties | Details of the event | Same names and units everywhere: amount in one currency, plan from one list |
Then add one rule for every shared field: how it is spelled. Emails are lowercased and trimmed, countries use one code list and amounts use one currency. Most "the numbers do not match" disputes come from skipping this step. Matching people across sources by a normalised key is the identity half of the problem; the technique is covered in identity resolution.
A worked example: merging three user lists
Sample data: a company has three places that hold users, each with an email address.
- Web app: 5,000 users
- CRM: 3,200 contacts
- Support chat: 1,800 people
Some people appear in more than one: 1,500 are in both web and CRM, 700 in both web and chat, 600 in both CRM and chat, and 300 are in all three.
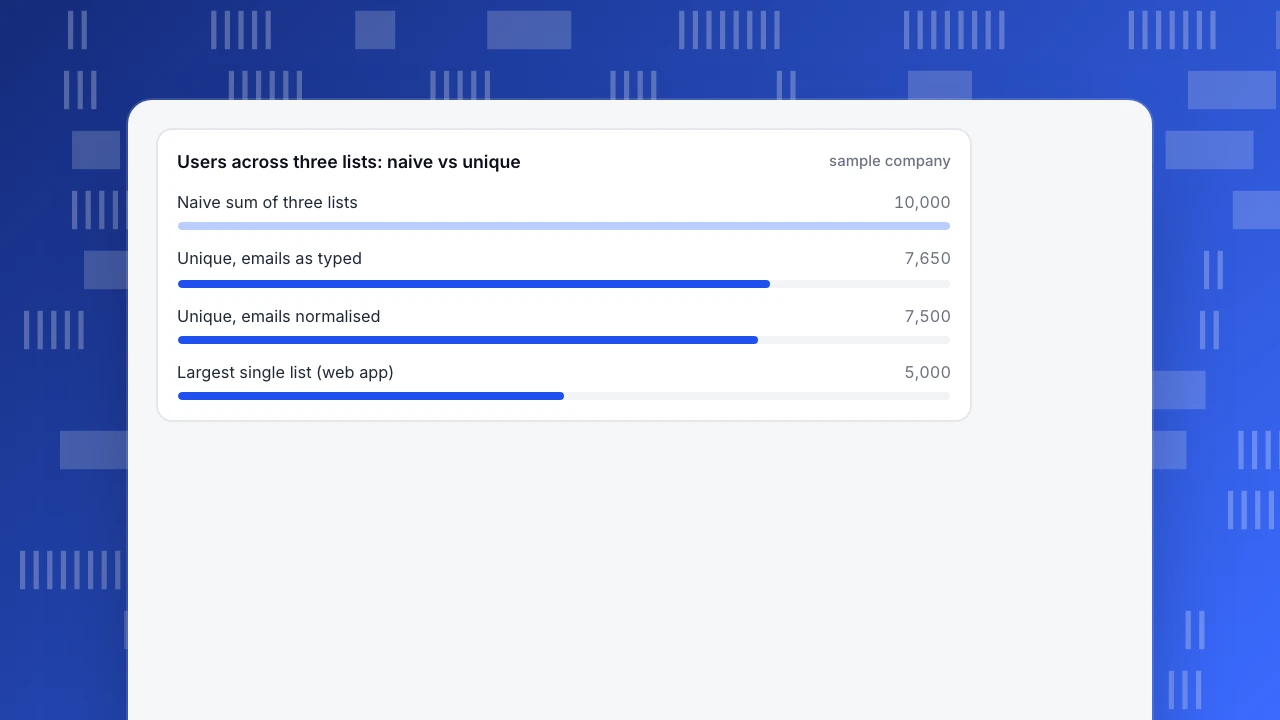
The naive total is 5,000 + 3,200 + 1,800 = 10,000. That counts overlapping people more than once. The unique count uses inclusion and exclusion: add the three lists, subtract each pair overlap, then add back the three-way overlap that was subtracted too often.
5,000 + 3,200 + 1,800 − 1,500 − 700 − 600 + 300 = 7,500 unique people.
The naive total overstates the audience by (10,000 − 7,500) ÷ 7,500 = 33%. Put the other way, 25% of the naive count is duplicates.
Broken down by where each person appears, the 7,500 splits into:
| Appears in | People |
|---|---|
| Web only | 3,100 |
| CRM only | 1,400 |
| Chat only | 800 |
| Web and CRM only | 1,200 |
| Web and chat only | 400 |
| CRM and chat only | 300 |
| All three | 300 |
| Total | 7,500 |
Now the catch: matching depends on the rule. If emails are compared as typed, Ana@Example.com and ana@example.com look like two people. Suppose 150 of the overlapping pairs fail to match for that reason, so the count reads 7,500 + 150 = 7,650. A lowercase-and-trim step costs nothing and removes the error. Check the result by looking at the one number you can verify: for each source, the unique count after merging must be at least as large as the biggest single source (5,000 here) and never larger than the naive sum (10,000).
Users across three lists: naive vs unique
sample companyCommon mistakes in data integration
- Building the pipeline before agreeing on definitions. Moving data faster only spreads the disagreement. Agree on what an active user is first.
- No stable person id. Without one, merging falls back on guesses such as name or IP address, and the user count drifts.
- Copying personal data into every tool. Each copy needs its own protection and deletion handling. Keep personal fields where they are needed and pass an id instead.
- Importing the same file twice. Without a dedupe key, a repeated load doubles the rows. Record what was loaded and when.
- Treating a one-off import as a live feed. A CSV loaded in March is not a connection. Label imported history as such so nobody expects it to update.
- No count check per source. A silent break shows up as a number that is slightly low for weeks. Compare row counts per source per day.
How to unify events and identity in TapCub
Take the three lists from the example and ask how TapCub fits. TapCub is not an ETL tool. It does not copy tables between your systems. It gives you one project in which the data you send, import or collect shares one event table and one identity model, which is the minimum model above.
- Collect everything into one project. Sources registered under All-platform analytics › Data › Data sources (the website, iOS, Android and mini-program SDKs among them) share one identity and one event table. Check the Last event time for each source; that is your per-source freshness check.
- Send backend events from the server. Events that only your server knows about, such as an order confirmed by the payment system, go in through the server HTTP interface with an API key from Configuration › Settings › API keys. See send server-side events.
- Import history once. All-platform analytics › Data › Data import takes a CSV of events, a CSV of user properties, or an Nginx or Apache log, up to 100,000 rows per file. In the wizard you map each column to a field, check a preview of the first 20 rows, then run it. Imported events are marked with the platform
import, so you can filter them out. Two limits matter for the example: loading the same file twice gives two copies, and visitors created from a log file do not merge with visitors from the SDK. - Link people with a login id. After
tapcub.login()binds a login id to a device, the person appears once in All-platform analytics › Users › People, across web, app and mini-program. Identified mode needs the Pro plan or above and is switched on by contacting support. In the CSV of user properties, an email or phone is hashed before it is bound. - Check how much was merged. All-platform analytics › Users › Identity map compares visitors, devices and users over the chosen dates and shows how many duplicates the merge removed. It is the counterpart of the 10,000 versus 7,500 check in the example.
Anything outside the project, such as the CRM list, stays in the CRM. You can import its properties by CSV, but TapCub will not keep it in sync.
FAQ
What are the main approaches to data integration?
Four cover most cases: point-to-point links between tools, batch ETL or ELT into a central store, a unified data layer built on a shared event and identity model, and real-time streaming of events. Most organizations use more than one, for example batch for history and streaming for alerts.
What is unified data?
Unified data is data from several sources that can be read as one consistent set: the same person appears once, and fields share names, types and units. It needs both a shared identity and a shared schema; collecting everything in one place is not enough on its own.
What does data movement mean?
Data movement is any process that copies or sends data from one system to another: a nightly export, a batch load into a warehouse, a continuous event stream or a one-off file import. Each approach above is a different pattern for when and how that movement happens.
How do I integrate data from different sources without a data engineer?
Start by agreeing on one event list and one person id, then use products that collect into a shared model, plus a one-time import for history. Add a warehouse or pipeline only when volume, history or the number of tools clearly needs it.
Does AI change how data integration works?
AI tools can propose field mappings or spot duplicates, but they still depend on the same two foundations: a stable identity and consistent definitions. Models fed inconsistent inputs produce inconsistent answers, so fix those first.
Sources
Was this article helpful?
We use your answers to fix and expand this page.
Couldn’t send. Please try again in a minute.
Thanks for the feedback. We’ll use it to improve this page.You’ve already sent feedback on this page. Thanks.

Data Analyst
Explores traffic sources, conversion funnels, and retention, using clear metric definitions and concrete examples to explain what the numbers mean.