Try it on your own data
Every report in this article is in the free plan. One snippet for web and apps, up to 10 sites.
Start freeOpen source BI fits teams that have someone to maintain it: the download is free, but data sources, permissions and operations are where the hidden cost sits. In the sample below, the self-hosted option costs $104,400 over three years with labour counted and $14,400 without it, so the real question is whose hours these are.
What you will learn
- Verify capabilities such as single sign-on and row-level permissions in the edition you will run, not the demo
- Price data-source connections, permissions and operations as monthly hours
- Keep two totals, with and without labour, because the ranking can reverse
What counts as open source BI, and what are you really choosing between?
Open source BI (business intelligence) is software for querying data and presenting it as dashboards and reports, whose source code is available under an open licence. Search results use the phrase for three different kinds of tool, and picking the wrong kind is the first mistake:
| Kind | Strong at | Weak at | Typical editions |
|---|---|---|---|
| Dashboard and exploration tools | Self-service questions, charts for non-engineers | Pixel-perfect printed reports | A free community edition and a paid edition |
| Reporting engines | Formatted, scheduled documents and invoices | Interactive exploration | Library or server, often developer-oriented |
| Full BI suites | Data integration, cubes, dashboards, reports | Simplicity; heavier to run | Community and enterprise editions |
Most of the real decision sits in the edition row, not the tool kind. The version you can download for free and the version a business ends up needing are often different: capabilities such as single sign-on, row-level permissions or audit logs may sit in the paid edition or have to be built around the free one. For how BI differs from wider data analytics, see BI vs data analytics, and for the platforms between the two, data analytics platforms.
This article does not repeat the general cost of self-hosting analytics, licences and the GDPR duties, which are in open source analytics. It covers what is specific to BI, and its claim is: open source BI fits teams that have someone to maintain it, and the hidden costs are data sources, permissions and operations.
What is the gap between "can query a database" and "can run the company's reporting"?
A demo connects to one database and draws a chart. A company needs more. Write down the capabilities you will need in the first year, and for each one verify, in the edition you will actually run, whether it exists, sits in a paid tier or has to be built:
| Capability | Why a business needs it | Verify in the edition you will run |
|---|---|---|
| Connectors for your data sources | Reports are only as good as the data they reach | Is each of your sources supported? |
| Single sign-on | Staff leave; passwords should not | Is it in the free edition? |
| Row-level permissions | Each region or client sees only its rows | Is it supported, and how is it configured? |
| Scheduled delivery | Executives read email, not dashboards | Email, chat, and alert thresholds |
| Embedding | Showing charts inside your own product | Licence terms for embedding |
| Audit log | Who looked at what | Present or absent |
| Query caching | Keeps the database and the dashboards fast | Configurable? |
| Shared metric definitions | One definition of "revenue" for all reports | A semantic layer, or copy-paste |
| Versioning of dashboards | Undo and review changes | Export or version history |
| Support and a security contact | Someone answers when it breaks | Community only, or an agreement |
Count how many rows are "present in the free edition", "in a paid tier" and "build it ourselves". The last two columns are the hidden costs the next sections price.
| Capability | Why a business needs it | Verify in the edition you will run |
|---|---|---|
| Connectors for your sources | Reports depend on the data they reach | Is each of your sources supported? |
| Single sign-on | Access should end when staff leave | Is it in the free edition? |
| Row-level permissions | Each region or client sees only its rows | Supported, and how configured? |
| Scheduled delivery | Executives read email, not dashboards | Email, chat, alert thresholds |
| Shared metric definitions | One definition of revenue | A semantic layer or copy-paste |
Five of ten capabilities; the rest are in the article.
Hidden cost 1: how much work is it to connect the sources?
The tool's connector list is not the same as your list. Check each of your five most important sources for three things: is there a supported connector, how is it authenticated and who rotates the credentials, and how fresh can the data be.
The usual pain points:
- A source with no connector. You land the data in a database the tool can read, which means building and running a pipeline.
- Credentials. Each connection holds a password or key that someone must store, rotate and revoke.
- Heavy queries on the live database. A dashboard run against an operational database can slow the application, so teams build a read replica or a warehouse, which is another system to run.
A fair estimate for each unsupported source is a one-off build plus a monthly maintenance hour or two. Put those hours into the cost table; they rarely appear in any comparison page.
Hidden cost 2: who controls what people can see?
Permissions are where open editions most often differ from paid ones, and where mistakes are expensive. Test with real cases:
- A regional manager must see only their region's rows. Can you enforce that on the data, not only by hiding a chart?
- A contractor needs one dashboard for 30 days. Can access expire?
- Someone asks who has viewed salary data. Is there a log?
If the answers are "build it" or "pay for the enterprise tier", price that now. A reporting tool that cannot enforce row-level access ends up with one copy of each report per audience, and each copy is a maintenance item.
Also decide who may create things. Open-ended build access tends to produce hundreds of dashboards and no shared definitions; a small group of builders and many viewers is easier to govern.
Hidden cost 3: who keeps it fast, patched and alive?
Operations include the application server, the metadata database that stores dashboards, caching, backups and upgrades. Dashboards that load slowly are abandoned, and a BI tool that people stop opening saves no money. Plan for:
- Upgrades. Check how often releases include migrations and how the project communicates breaking changes.
- Backups. Dashboards and definitions are your work product; back up the metadata database as you would any other.
- Monitoring. Someone must notice when a scheduled report fails to send.
Compare this with a hosted service, where these hours are part of the fee. The sample below puts numbers on that.
Worked example: what does it cost over three years?
Sample data: 5 people who build dashboards and 40 who only view, so 45 users, at $75 an hour for labour. Three options are anonymous types, not products.
| Item (3 years) | 1: self-hosted community edition | 2: open core with a paid tier | 3: commercial cloud BI |
|---|---|---|---|
| Licence | $0 | $15 × 45 × 12 × 3 = $24,300 | $25 × 45 × 12 × 3 = $40,500 |
| Infrastructure | $400 × 36 = $14,400 | $14,400 | included |
| Labour | 30 h/month × 36 × $75 = $81,000 admin, plus 120 h × $75 = $9,000 to build missing features, total $90,000 | 15 h/month × 36 × $75 = $40,500, plus 40 h × $75 = $3,000, total $43,500 | 4 h/month × 36 × $75 = $10,800, plus 40 h × $75 = $3,000, total $13,800 |
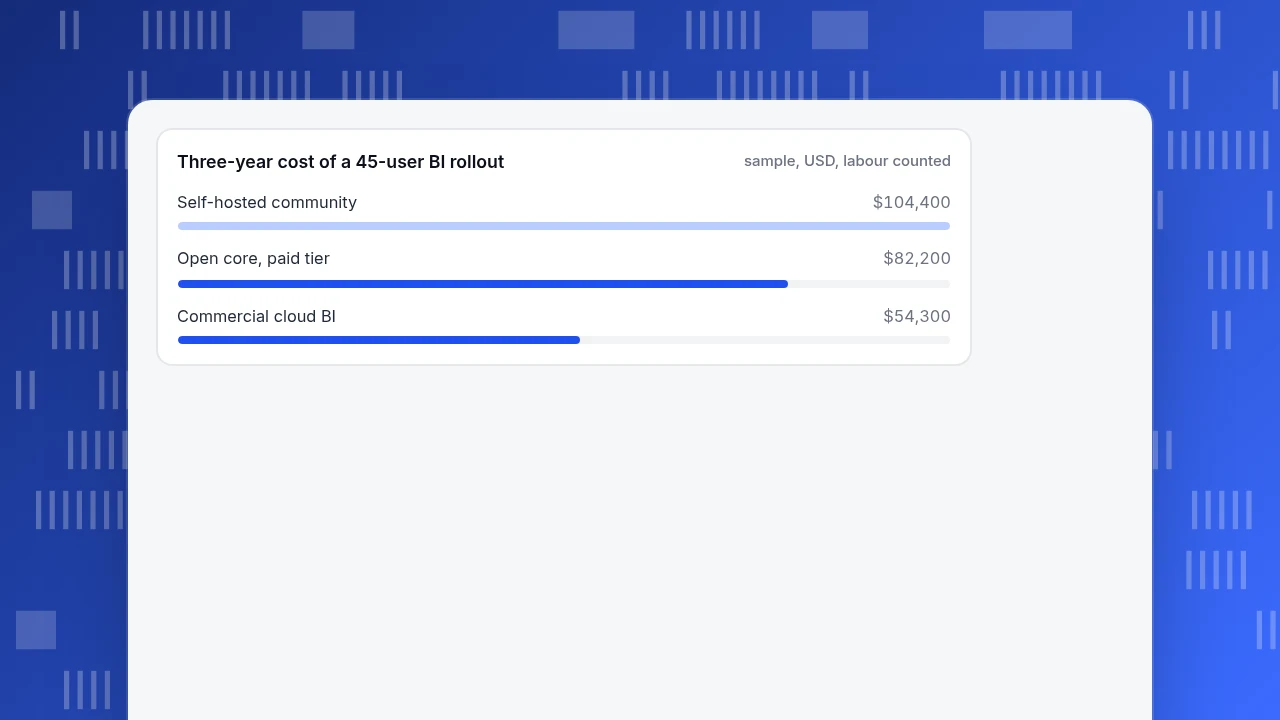
| Total with labour | $104,400 | $82,200 | $54,300 |
| Total without labour | $14,400 | $38,700 | $40,500 |
Recomputed: option 1 is 0 + 14,400 + 90,000 = 104,400; option 2 is 24,300 + 14,400 + 43,500 = 82,200; option 3 is 40,500 + 0 + 13,800 = 54,300.
Read the last two rows together. If every hour of labour is a real cost, the open source options are the most expensive, and the commercial service is cheapest by $50,100 against option 1. If the labour is already paid because a data engineer is on the payroll and has the hours spare, the picture reverses: option 1 costs $14,400 in cash and the others cost $38,700 and $40,500. So open source BI fits teams with maintainers; for everyone else, the licence saving is smaller than the labour it creates. The honest question is not "is it free?" but "whose hours are these?"
Three-year cost of a 45-user BI rollout
sample, USD, labour countedWhen does open source BI fit, and when does it not?
| If this is true | Lean towards |
|---|---|
| A data engineer already owns the stack and has spare hours | Open source BI |
| You must keep data inside your network or need code-level control | Open source BI |
| You need row-level permissions, audit and single sign-on from day one | Check the paid tier first |
| Nobody owns maintenance, and dashboards matter to executives | A hosted service |
| You want to start small and keep the option to move | A hosted edition of an open source tool |
| Your questions are about website or app behaviour | A product analytics tool may cover it without a BI layer |
How do you pilot an open source BI tool in five steps?
- Choose two reports that matter and write down the correct numbers from your current process.
- Install the edition you would run in production, not a demo build, and record the hours.
- Connect the two sources the reports need; note any source without a connector.
- Test one permission case (a user who sees only their region) and one scheduled delivery.
- Add up the hours and put them in the three-year table with both total rows.
If step 4 fails on the free edition, decide now whether the paid tier or a different tool is the real candidate.
Common mistakes with open source BI
- Treating "free to download" as the cost. In the sample, the free option had the highest total once labour counted.
- Piloting a different edition from the one you would run. Capabilities you tested may not be in the version you deploy.
- Ignoring permissions until launch. Retrofitting row-level access means rebuilding reports.
- Letting everyone build. Hundreds of dashboards with competing definitions replace one trusted number.
- No cache or replica plan. Dashboards that slow the live application get switched off, by the application's owners.
- Not asking whose hours. A tool with a maintainer is cheap; the same tool without one is a liability.
Where does TapCub sit next to a BI tool?
TapCub is not a BI tool and it is not open source; it is a hosted service for web, app and mini-program analytics and live chat. It does not connect to your warehouse or finance systems. The useful question for a team weighing BI is which of your questions need a BI layer at all.
- Questions about visitors and users. Funnels, retention, paths, sources and segments are built in. In All-platform analytics › Behavior › Metrics & SQL you can define metrics once and run SQL over the project's event data, so behaviour questions do not need a BI build.
- Boards for those questions. Saved analyses go on a dashboard under All-platform analytics › Overview › My dashboards, shared as a read-only link with an optional password (at most the last 90 days).
- Getting data to your BI tool. If a report needs behaviour data next to finance data, raw detail leaves through the asynchronous export in All-platform analytics › Data › Data export; table exports offer CSV and XLSX, with XLSX built at most 50,000 rows at a time. TapCub does not provide a live warehouse connection.
- Access. Saving analyses needs an analyst role or above; turning sharing on needs an admin or the owner.
So the pattern is: keep BI for finance, operations and cross-system joins; use TapCub for behaviour, and export when the two must meet.
FAQ
What is open source BI?
Open source BI is business intelligence software, used to query data and build dashboards and reports, whose source code is available under an open licence. The category includes dashboard tools, reporting engines and full suites, usually with a free community edition and a paid edition.
Is open source BI really free?
The download is free; running it is not. In the sample, the self-hosted option cost $104,400 over three years once labour was counted, against $54,300 for a commercial cloud service. It is cheaper only when the maintenance hours are already paid for.
What features are missing in free open source BI?
It varies by project and edition, so verify rather than assume. Capabilities that are often in a paid tier or need extra work include single sign-on, row-level permissions, audit logs and embedding. Check each against the edition you will deploy.
How much does it cost to maintain open source BI?
Plan for administration hours every month plus infrastructure. The sample assumed 30 hours a month and $400 of infrastructure, giving $14,400 in cash and $90,000 in labour over three years. Replace the assumptions with your own and keep both totals.
Is open source BI the same as open source analytics?
They overlap. BI focuses on querying business data into dashboards and reports; analytics tools often start from events on a site or app. The cost and licence questions are covered in the open source analytics guide, and the BI-specific ones are above.
Sources
- Open Source Initiative. The Open Source Definition — what a licence must allow to be called open source. Verified 2026-11-19.
- The Apache Software Foundation. Apache License, Version 2.0 — a widely used permissive licence, for contrast with copyleft licences. Verified 2026-11-19.
- Wikipedia. Business intelligence software — typical capabilities such as reporting, dashboards and data integration. Verified 2026-11-19.
Was this article helpful?
We use your answers to fix and expand this page.
Couldn’t send. Please try again in a minute.
Thanks for the feedback. We’ll use it to improve this page.You’ve already sent feedback on this page. Thanks.

Data Engineer
Writes about event design, data quality, and collection workflows, with verifiable implementation methods for reliable analytics.