Try it on your own data
Every report in this article is in the free plan. One snippet for web and apps, up to 10 sites.
Start freeA personalized shopping experience is a store that changes what it shows, and in what order, based on who is looking and what they have done. It only works as well as your understanding of behaviour: what shoppers viewed, added to the cart and bought again decides what to show. Below: three layers from simple rules to individual recommendations, the data each needs, a recomputed test, and the privacy limits.
What you will learn
- Start with context rules and segments; item-level recommendations need purchase history that small stores do not have
- Test with a parallel group and check significance: an 18.4% lift on 5,000 sessions per group was not yet conclusive (p ≈ 0.08)
- Use first-party behaviour you can explain to the shopper, and honour objections to profiling
What counts as a personalized shopping experience?
A personalized shopping experience is one where the store changes what it shows, in what order or with what message, depending on who is looking and what they have done. A returning shopper who browsed running shoes sees running shoes first; a new visitor from a gift-guide campaign sees the gift collection. Nothing about the product changes; what changes is the selection and the order.
It is useful to separate three things that get blurred together:
- Segmentation puts shoppers in groups and treats each group alike (for example, customers who have not ordered in 90 days). See customer segmentation analysis.
- Personalization changes the experience for a group or a person using what you know.
- Hyper-personalization does it in real time with machine learning, one shopper at a time, across many signals. That is covered in hyper-personalization; this guide is the step before it, and for most stores it is the step that pays.
The core idea of this guide: personalization only works as well as your understanding of behaviour. If you cannot say what people viewed, added to the cart and bought again, you cannot decide what to recommend, and no tool will fix that for you.
What are the three layers of personalization?
Most stores can start at the first layer in an afternoon and should earn the right to reach the third. Each layer needs more data and more care than the one before.
| Layer | What changes | Data it needs | Effort | Main risk |
|---|---|---|---|---|
| Context rules | Currency, language, shipping message, banner by device, new versus returning visitor | Location, device, whether the visitor has been here before | Hours | Wrong guess about location or language |
| Segment-based | Homepage block, email, offer or message per group such as champions or at-risk buyers | Orders over time, category views, source | Days to weeks | Segments too coarse to matter |
| Individual | Product recommendations and ordering per shopper | Item-level views, carts and purchases for each person | Weeks to months, usually a dedicated tool | Over-personalizing; thin data for new shoppers |
A rule of thumb for choosing: if you have fewer than a few hundred orders a month, stay on the first two layers. Item-level recommendations need enough purchase history to find patterns, and below that volume a bestseller list per category performs about as well with none of the maintenance. The question for each layer is the same: what do I know about this shopper that I can act on today?
| Layer | What changes | Data needed | Main risk |
|---|---|---|---|
| Context rules | Currency, language, banner by device | Location, device, new or returning | Wrong guess |
| Segment-based | Block, email or offer per group | Orders over time, category views | Segments too coarse |
| Individual | Recommendations per shopper | Item-level views, carts, purchases | Over-personalizing, thin data |
Below a few hundred orders a month, stay on the first two layers.
What data does personalization actually need?
Start with first-party behaviour, meaning what shoppers do on your own store. It is more relevant than demographics and does not depend on third parties. Not every signal needs to be used; pick the ones you can act on.
| Signal | Where it comes from | What you can do with it | Care needed |
|---|---|---|---|
| Pages and categories viewed | Page views | Show the category they looked at on the next visit | Do not use view signals for sensitive categories |
| On-site search terms | Search events | Reorder results; fix empty-result searches | Search text can contain personal data |
| Add to cart, remove from cart | Events | Remind them; hide items already bought | Do not remind someone who is checking out now |
| Purchase history | Orders | Recency, frequency, spend groups; replenishment timing | Only for logged-in or identified customers |
| Source and campaign | UTM, referrer | Match the landing message to the campaign | Do not overfit to one campaign |
| Device and country | Browser data | Layout, language, currency, shipping | Keep to what the visitor would expect |
| Support conversations | Chat | Learn recurring questions to answer on the page | Keep personal details out of the analysis |
For the measurement side, ecommerce analytics covers which events to track across the shop. One constraint matters here: an anonymous visitor has no history you can use across devices, so purchase-based personalization is only possible once the shopper logs in or checks out.
Worked example: does a personalised block actually lift orders?
Sample data: a store shows returning visitors a "continue where you left off" block with the category they last viewed. Before rolling it out, it splits 10,000 returning sessions in one month into two equal groups of 5,000, and tracks orders. All numbers are invented.
| Group | Sessions | Orders | Conversion rate |
|---|---|---|---|
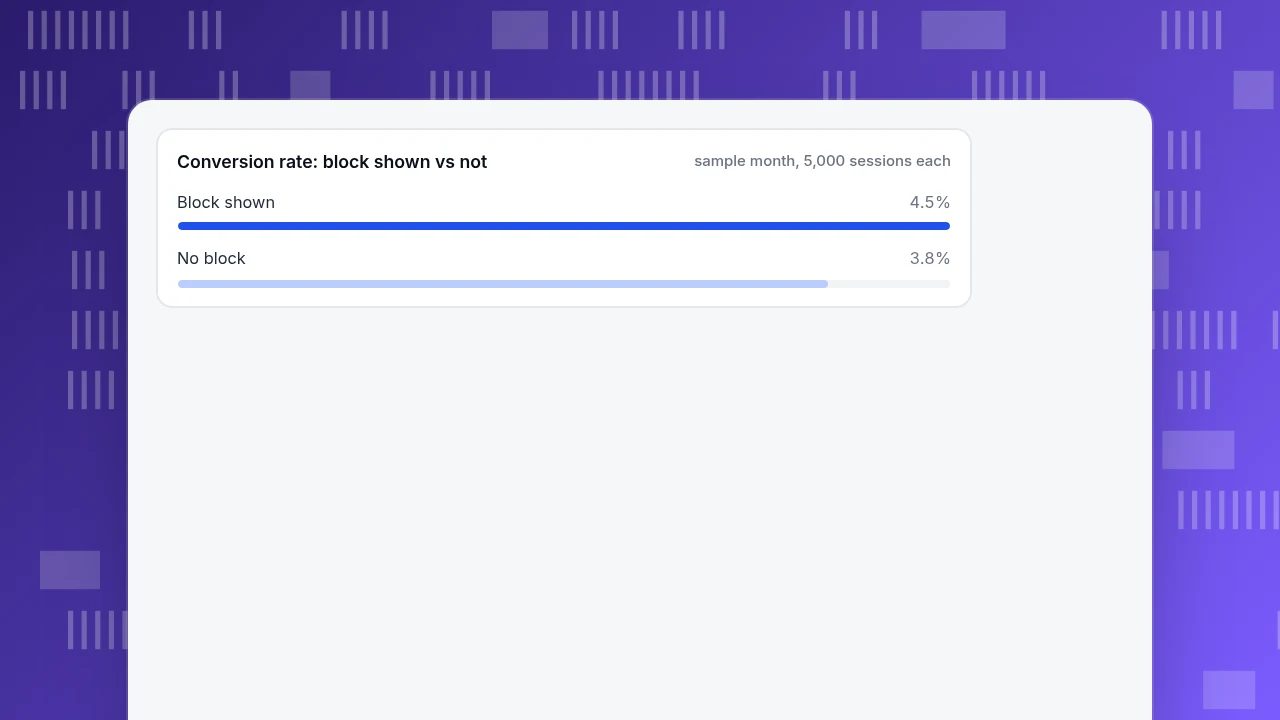
| Block shown | 5,000 | 225 | 225 ÷ 5,000 = 4.5% |
| No block | 5,000 | 190 | 190 ÷ 5,000 = 3.8% |
- Relative lift: 4.5% ÷ 3.8% − 1 = 18.4%
- Extra orders in the test: 225 − 190 = 35
- Average order value $62 and gross margin 40%: 35 × $62 × 40% = $868 extra gross margin per 5,000 sessions
Before you celebrate, check whether the gap is bigger than chance. With 5,000 sessions per group, the standard two-proportion test gives a z-score of about 1.75, and a p-value of about 0.08. That is suggestive but not conclusive at the usual 5% level. To detect a difference of this size (3.8% versus 4.5%) with 80% power you would need about 12,700 sessions per group, so this test needs roughly two and a half times more traffic before you decide.
Three conclusions follow:
- A visible lift in a small test is a reason to keep testing, not to roll out and stop measuring.
- The value in money is $868 per 5,000 sessions, so at 10,000 returning sessions a month it is about $1,736 of gross margin, and that is before the cost of the tool and the time to maintain it.
- If the block had been shown to everyone and compared with last month, seasonality would have been mixed into the 18.4%. A parallel group is what makes the number believable.
Conversion rate: block shown vs not
sample month, 5,000 sessions eachWhich segment should get which treatment?
Layer two is where RFM (recency, frequency, monetary) segmentation helps. It ranks each customer on how recently they bought, how often and how much, and groups them. See RFM for the scoring. Then you decide the treatment per group instead of one message for all.
| Segment | Who they are | Treatment to try | Not to do |
|---|---|---|---|
| Champions | Bought recently, often, spend a lot | Early access, new arrivals first | Discounts they do not need |
| Loyal | Buy regularly | Replenishment reminders, loyalty perks | Over-messaging |
| New | First purchase recently | Onboarding: care, usage, second-purchase suggestions | Heavy promotion at once |
| About to sleep | Purchases slowing down | Show what they viewed before, a reminder | A deep discount straight away |
| At risk | Used to buy often, silent now | A win-back message with a reason to return | Pretending nothing happened |
| Hibernating | Long inactive | A low-effort reactivation, then stop | Frequent emails |
The treatments are starting points to test, not a guarantee; the table works because each row names what is different about the shopper, and the action follows from that.
How do you personalise without crossing the line?
Personalization stops feeling useful and starts feeling invasive when the shopper cannot see why they are being shown something. A few working rules:
- Use what the shopper would expect you to know. Showing the jacket they viewed yesterday is fine; referring to something they said in a private chat is not.
- Keep sensitive categories out. Health, finance and similar topics need extra care; do not infer them from browsing.
- Make it easy to turn off. Under EU law, a person has the right to object to profiling used for direct marketing, and once they object you must stop (GDPR Article 21(2) and (3)). It applies to marketing emails and to profile-based offers.
- Prefer first-party data. It is what you collected yourself, for a purpose the shopper can understand.
- Do not over-personalize. If every block changes with every visit, shoppers cannot find the same thing twice. Keep navigation stable and personalize selection inside it.
This is general information, not legal advice; the rules depend on where your shoppers are.
Which mistakes make personalization fail?
- Starting at the third layer. Buying a recommendation engine before you have layer-one rules and a clean event setup gives you an expensive bestseller list.
- Personalising on demographics alone. Age or location says little about what someone wants now; what they viewed and bought says more.
- No parallel group. Without a comparison group, the numbers fold seasonality and campaigns into the lift.
- Reading a lift too early. The example above shows 18.4% that is not yet significant.
- Recommending what the shopper already bought. Hide purchased items, except for consumables where timing is the point.
- Forgetting new and anonymous visitors. Most traffic has no history; give them a good default, not an empty slot.
How can you build the behaviour picture in TapCub?
TapCub does not personalize your store. It has no recommendation engine, does not change what your pages show, does not run A/B tests and does not send email. It shows the behaviour that personalization depends on and measures whether it worked. Here is the example above run through TapCub.
- Track the shopping events. Make sure product views, add-to-cart and purchases are sent (see track ecommerce purchases). Visitors who log in with
tapcub.loginappear in All-platform analytics › Users › People with a day-by-day timeline of what they viewed and bought. - Build the segments. In All-platform analytics › Users › Segments & tags, create an RFM segment with your purchase event and amount property. It refreshes daily and groups customers into ten buckets, from champions to hibernating; the steps are in run RFM analysis. Anonymous visitors have no profile, so they are not in segments.
- Look at how segments behave. In All-platform analytics › Behavior › Behavior analysis, use the segment as a group in a funnel to see where champions and at-risk customers diverge, for example how far each group gets from category page to purchase.
- Measure the test. Run the split in your own testing tool, with the variant shown to one group. Send a property such as
variantwith the order event, then compare the order conversion of the two groups in All-platform analytics › Behavior › Behavior analysis. TapCub reports the numbers; the sample size, the significance test and the margin calculation are yours. - Know the boundary. TapCub does not decide who sees what, does not recommend products and does not hold back a random group. The treatment happens in your store or email tool; TapCub is where you see whether it moved the numbers.
FAQ
What is a personalized shopping experience?
It is a store experience that changes what it shows, and in what order, based on who the shopper is and what they have done. The change can be as simple as a currency or as complex as per-shopper product recommendations. What matters is that it is based on information you can explain to the shopper.
What data do you need to personalize shopping?
Start with first-party behaviour: pages and categories viewed, searches, add-to-cart and purchase history, plus source and device. Purchase-based personalization needs the shopper to be identified through login or checkout. Use the signals you can act on today, not every signal you can collect.
What are the benefits of personalized shopping?
Done well it makes products easier to find and messages more relevant, which can raise conversion and repeat purchases. McKinsey reports that more than 70% of consumers consider personalization a basic expectation. In your own store the benefit should be measured against a comparison group, as in the example.
How do you personalize without being creepy?
Use what the shopper would expect you to know, such as products they viewed, keep sensitive categories out, and make opting out easy. Under EU law the right to object to profiling for direct marketing is explicit. If you could not explain to the shopper why they see something, do not show it.
How do you measure whether personalization is working?
Compare shoppers who saw the personalized experience with a similar group who did not, over the same period, and compare orders and margin, not clicks. Check that the gap is larger than chance before rolling out, and keep a small holdout group running after launch.
See also: Web Personalization Steps: From Segment to Measured Lift.
Sources
- McKinsey & Company. The value of getting personalization right—or wrong—is multiplying (2021) — more than 70% of consumers consider personalization a basic expectation. Checked 2026-11-19 against search summaries.
- European Union. Regulation (EU) 2016/679 (GDPR), Article 21(2)–(3) on the right to object to processing for direct marketing, including profiling. Checked 2026-11-19.
Was this article helpful?
We use your answers to fix and expand this page.
Couldn’t send. Please try again in a minute.
Thanks for the feedback. We’ll use it to improve this page.You’ve already sent feedback on this page. Thanks.

Product Analyst
Focuses on event analysis, conversion funnels, and retention, using clear metric definitions and structured analysis to explain product performance.