Try it on your own data
Every report in this article is in the free plan. One snippet for web and apps, up to 10 sites.
Start freeThe steps of web personalization are: set one goal and metric, check what data you may use, pick a segment, design one variation, test it against a holdout and measure the lift before rollout. In the worked example, a cart banner lifted conversion from 4.20% to 4.92%, a 17.1% gain that plausibly ranges from 3% to 31%. The range, not the point, decides whether to ship.
What you will learn
- Run six steps in order: goal, data and consent, segment, one variation, holdout test, lift with a range
- Size the segment first: at a 4.2% baseline you need about 17,000 visitors per group to detect a 15% lift
- Report lift as a range and price the low end; roll out only if it covers the build and upkeep
What are the steps of web personalization?
Web personalization has six steps: set one goal and metric, check what data you may use, pick a segment, design one variation, test it against a holdout, and measure the lift before you roll it out. The order matters. Teams that start with the variation (step 4) and measure afterwards end up with a page that feels personal and a number nobody trusts. This article follows one example through all six steps with the arithmetic shown. For the wider concept and its advanced forms, see hyper-personalization; for how shoppers experience it, see personalized shopping experience.
| Step | Question it answers | What you produce |
|---|---|---|
| 1. Goal | What should change, measured how? | One metric and a target |
| 2. Data and consent | What may we use? | A list of allowed signals |
| 3. Segment | Who gets the change? | A rule and a size |
| 4. Variation | What do they see instead? | One change, written down |
| 5. Holdout test | Did it cause the change? | Control and variant results |
| 6. Lift and rollout | Is it worth keeping? | A decision with a range |
| Step | Question it answers | What you produce |
|---|---|---|
| 1. Goal | What should change, measured how? | One metric and a target |
| 2. Data and consent | What may we use? | A list of allowed signals |
| 3. Segment | Who gets the change? | A rule and a size |
| 4. Variation | What do they see instead? | One change, written down |
| 5. Holdout test | Did it cause the change? | Control and variant results |
| 6. Lift and rollout | Is it worth keeping? | A decision with a range |
Skipping the holdout in step 5 is the most common failure.
Step 1: What is the one goal, and how will you measure it?
Pick a single metric tied to a business outcome, with a baseline. Example used throughout (sample data): an online shop wants more orders from returning visitors who added to cart but did not buy within seven days. The metric is order conversion rate for that group, and the baseline is 4.2%.
Why bother? McKinsey's Next in Personalization 2021 survey, with 1,013 US adults in September 2021, reported that 71% of consumers expect companies to deliver personalized interactions and 76% get frustrated when this does not happen. That tells you personalization is worth attempting, but not whether your change works. Only your own metric can say.
Step 2: What data may you use?
List the signals you actually have and are allowed to use: page views, referring source, previous visits, cart contents, a logged-in identity. Anonymous visitors do not have a profile, so the signal must be something you can observe in the session or in a first-party identifier.
Check the rules for your audience. Under Article 21 of the EU's GDPR, a person has the right to object at any time to processing for direct marketing, including profiling, and once they object their data may no longer be used for that purpose. Build the opt-out into the design, and apply the stricter rule if you serve several regions. If you are not sure that a signal is allowed, leave it out of the first test.
Step 3: Who is in the segment, and is it big enough?
Write the rule as an if-statement a colleague could check: returning visitor, cart value above $40, no purchase in 7 days. Then size it before you build anything.
Sample data: this rule matches 20,000 visitors in the test window. With a 4.2% baseline, how many are needed to detect a lift? For 80% power at the 5% significance level, a standard two-proportion calculation gives about 17,000 visitors per group to detect a 15% relative lift (4.2% to 4.83%), and about 9,800 per group to detect a 20% relative lift. With 10,000 per group the test can reliably find lifts of about 20% or more. If the segment is too small, widen the rule (drop the cart-value threshold) or run the test for longer.
Step 4: What single change do they see?
Change one thing, so a result can be attributed. Sample data: visitors in the segment see a banner under the header, "You are $12 away from free shipping," based on their cart value, while the control group sees the usual page. Write down the hypothesis before launch: the banner reduces surprise at shipping cost, so conversion in this segment rises. A hypothesis tied to a known reason is easier to learn from than "personalized banner."
Keep the control page identical to what visitors saw before the test, so the comparison measures the banner and nothing else. Two guardrails keep the variation honest: show nothing that reveals sensitive data (a banner that mentions a health purchase is a privacy problem, not a feature), and keep the experience coherent if the segment rule stops matching halfway through a visit.
Step 5: How do you test it against a holdout?
Randomly split the segment, not the whole site. Half sees the personalized banner, half does not. The holdout is what turns a before-and-after story into a measurement, because both groups live through the same weekdays, promotions and weather.
Sample data from the test, 10,000 visitors per group:
| Group | Visitors | Orders | Conversion |
|---|---|---|---|
| Control | 10,000 | 420 | 4.20% |
| Variant | 10,000 | 492 | 4.92% |
Keep the split for the whole planned period. Stopping the moment the result looks good inflates false positives. Decide the end date from the sample size in step 3.
Step 6: How do you calculate lift and decide to roll out?
Compute absolute lift, relative lift and a range.
- Absolute lift: 4.92% − 4.20% = 0.72 percentage points.
- Relative lift: 4.92 ÷ 4.20 − 1 = 17.1%.
- Significance: pooled conversion = (420 + 492) ÷ 20,000 = 4.56%; the two-proportion z-statistic is about 2.44, above the 1.96 needed at the 5% level.
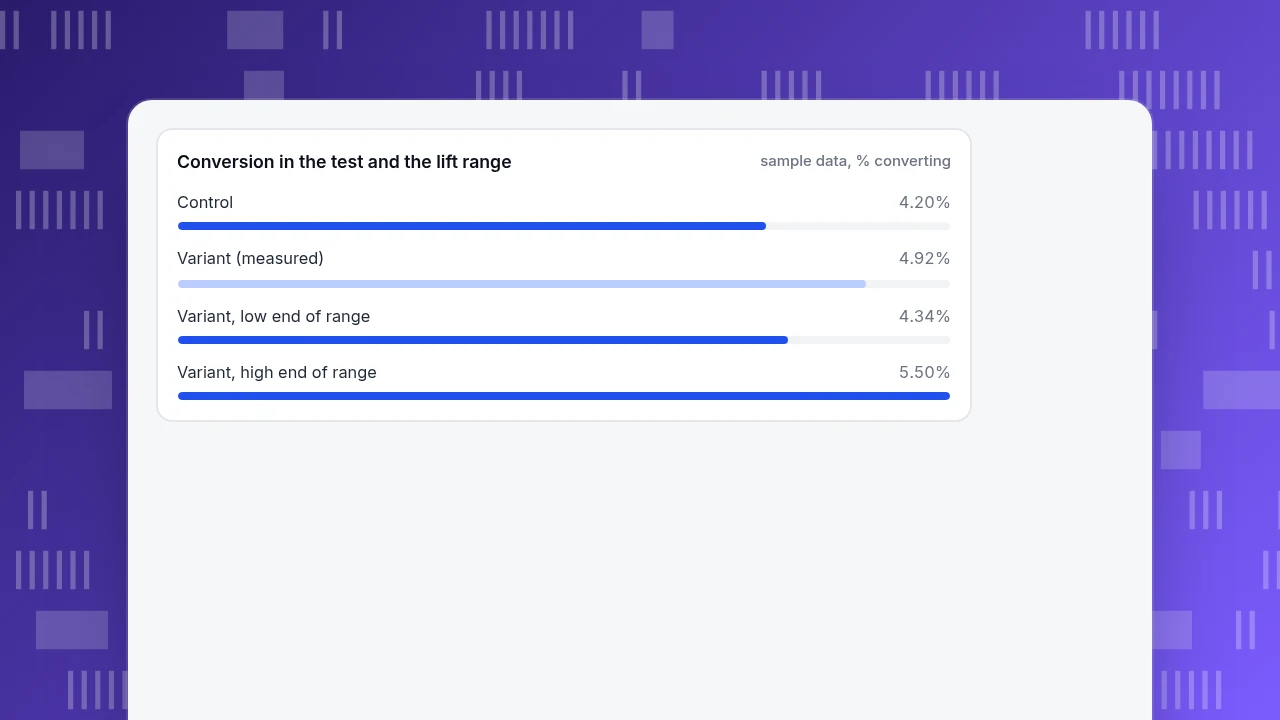
- Range: the 95% interval on the difference runs from about 0.14 to 1.30 percentage points, which is a relative lift of roughly 3% to 31%.
The honest summary is "17% in this test, plausibly anywhere from 3% to 31%." Convert the low end into money before deciding. Extra orders in the test period: 492 − 420 = 72. At $24 gross margin per order that is 72 × $24 = $1,728; at the low end of the range (a 3.4% relative lift, about 14 orders) it is about 14 × $24 = $336, a fifth of that. If the build and upkeep cost less than the low-end figure, roll out. If they cost more than the point estimate, do not. Then keep a small holdout after the rollout, so you notice if the lift fades.
Conversion in the test and the lift range
sample data, % convertingHow long should the test run?
Work it out from traffic, not from a feeling. Sample data: the segment produces about 5,000 qualifying visitors a week. A test with 10,000 per group needs 20,000 visitors in total, which is 20,000 ÷ 5,000 = 4 weeks. Detecting the smaller 15% lift needs about 17,000 per group, so 34,000 ÷ 5,000 = 6.8 weeks, which you round up to 7.
Run whole weeks so every weekday appears the same number of times, and avoid starting on a promotion day. Watch for a novelty effect: a banner can win in week one because it is new, so compare the first and last weeks. If the lift in the last week is much smaller, trust the later number.
What goes wrong in web personalization?
- No holdout. A before-and-after comparison cannot separate the banner from the season.
- A segment too small to test. Fewer than a few thousand visitors per group only detects huge effects.
- Several changes at once. If you change copy, offer and layout together, you will not know which one worked.
- Personalizing on sparse data. A rule built on one page view guesses wrongly often enough to annoy people.
- Stale rules. A rule that worked in winter may not in summer; recheck with a small standing holdout.
How do you do the measurement side in TapCub?
Take the example above. TapCub does not serve personalized content or split traffic; it measures the segment and the outcome. The split and the banner happen in your site or your personalization tool.
- Define the goal. In Web analytics › Goals set the purchase as a goal, so the baseline of 4.2% comes from the same data you test against.
- Build the segment. In All-platform analytics › Users › Segments & tags create a rule segment from conditions such as did or did not do an event and properties. Anonymous visitors have no profile and are not in segments; identify logged-in users first so the segment can include them.
- Record which group each person saw. Send the group name from your site as an event or user property (for example banner = control or variant). The segment rule can also use a random-bucket condition if you want the split to live in TapCub.
- Read the outcome. Open All-platform analytics › Behavior › Event analysis, chart the purchase event and use the breakdown by that property to compare the two groups over the full planned period. Event analysis can break counts and users down by event or user properties.
- Mark the rollout. Add a note in Configuration › Annotations on the day you roll out, and keep watching the same funnel.
Bots and AI crawlers are counted separately, so crawler traffic does not distort the two conversion rates.
FAQ
What are the steps of web personalization?
Set one goal and metric, check which data you may use, pick a segment, design one variation, test it against a holdout group, and measure the lift with a range before rolling out. Skipping the holdout is the commonest failure.
How do you personalize a website?
Define a segment with a rule such as returning visitors with items in the cart, show that group one specific change, and compare conversion with a randomly held-out group. Roll out only if the low end of the lift range pays for the work.
How big does a personalization test need to be?
At a 4.2% baseline, about 17,000 visitors per group to detect a 15% relative lift and about 9,800 per group for 20%, at 80% power and 5% significance. Smaller segments only detect larger effects.
Is web personalization legal?
It depends on the data and the region. Under GDPR Article 21 people can object to profiling for direct marketing at any time. Build in an opt-out and check the law where your visitors live.
How do you measure the success of personalization?
Compare conversion for the personalized group against a randomly held-out group over the same period, and report the lift as a range. In the sample, 17.1% was the point estimate and roughly 3% to 31% the range.
Sources
- McKinsey and Company, The value of getting personalization right or wrong is multiplying (November 2021): 71% expect personalization, 76% frustrated when it is absent; survey of 1,013 US adults, 7 to 8 September 2021.
- GDPR-info.eu, Article 21 GDPR, Right to object: objection to direct marketing including profiling (checked 2026-11-20).
- NIST, Dataplot: binomial proportion test: pooled two-proportion test statistic used for the lift calculation.
Was this article helpful?
We use your answers to fix and expand this page.
Couldn’t send. Please try again in a minute.
Thanks for the feedback. We’ll use it to improve this page.You’ve already sent feedback on this page. Thanks.

Product Adoption Consultant
Explores customer onboarding, live conversations, and self-service, turning common usage questions into practical guidance and improvements.