Try it on your own data
Every report in this article is in the free plan. One snippet for web and apps, up to 10 sites.
Start freeUser interface design is the work of arranging controls, text, color and feedback so people can finish a task without thinking about the interface. Eight principles carry most of the weight, and each can be tested with a number: a response time, a contrast ratio, a target size, a frustration-click rate or a form completion rate. Below, each principle is paired with the metric and event that checks it.
What you will learn
- Every principle has a published threshold or a behavioral signal: 0.1/1/10 s responses, 4.5:1 contrast, 24 px targets, frustration clicks per 1,000 pageviews
- Pair an outcome metric (form completion) with a friction metric (error and rage clicks) so a gain is not bought with extra effort
- Five participants find about 84% of usability problems; fix them and test again with a new five
What is user interface design, and what is it not?
User interface (UI) design is the arrangement of everything a person touches or reads on a screen: controls, labels, layout, type, color, spacing and the feedback that follows each action. It is judged by one thing, whether people finish their task without stopping to work out the interface. The definition of the term itself is in the glossary entry on user interface.
UI is one layer of user experience, not all of it. Use this rule to decide which problem you have:
- People find the control but use it wrongly, miss it, or cannot read it: a UI problem. Change the interface.
- People use the interface correctly and still do not get what they came for: a UX or product problem. A cleaner button will not fix it.
The second kind is covered in UX metrics. This guide stays with the first: eight principles, and for each one a number you can measure before and after a change.
What are the eight principles, and where do they come from?
None of these is a taste preference. Each one traces to a published rule or a measurable threshold:
- Show system status. Every action gets a visible response. This is the first of Nielsen's ten usability heuristics, first published in 1994 and last reviewed by Nielsen Norman Group in January 2024.
- Respond fast enough. Nielsen's response-time limits are 0.1 second (feels instant), 1 second (the flow of thought holds) and 10 seconds (attention is lost). For pages, Google's web.dev rates Interaction to Next Paint at 200 ms or less as good, above 500 ms as poor, judged at the 75th percentile of real loads.
- Be consistent. The same thing looks and behaves the same way everywhere (heuristic 4, consistency and standards).
- Keep hierarchy clear and the screen minimal. One primary action per screen, and nothing on it competing without a reason (heuristic 8, aesthetic and minimalist design).
- Let people recognize rather than recall. Show options and labels instead of making people remember them (heuristic 6).
- Keep text legible. WCAG 2.2 success criterion 1.4.3 requires a contrast ratio of at least 4.5:1 for normal text and 3:1 for large text (18 pt, or 14 pt bold).
- Make targets big enough. WCAG 2.2 criterion 2.5.8 sets a minimum of 24 by 24 CSS pixels for pointer targets, with exceptions for spacing, inline links and browser-drawn controls.
- Prevent errors and make recovery easy. Stop mistakes before they happen and say what went wrong in plain words if they do (heuristics 5 and 9).
The table below pairs each principle with the number that tests it and the event or report that produces that number. The last two columns are the part most design guides leave out.
| Principle | Rule of thumb | Metric | Event or report |
|---|---|---|---|
| Show system status | Acknowledge every action; progress after 1 s | Task latency, share of actions with visible feedback | Custom events for click and success; funnel median time |
| Respond fast | Under 0.1 s feels instant; INP 200 ms or less at p75 | INP p75 per page | Real-user performance report |
| Be consistent | Same component, same look and place | Click-through of one component across pages | Click distribution by page |
| Clear hierarchy | One primary action per screen | Share of clicks on the primary action | Heatmap element table |
| Recognize, don't recall | Visible labels and options | Share reaching a page through site search or back-and-forth | Path analysis, on-site search terms |
| Legible text | 4.5:1 normal, 3:1 large text | Contrast ratio per color pair | Design review (no analytics event) |
| Big enough targets | 24 by 24 CSS px minimum | Frustration clicks per 1,000 pageviews | Rage-click and error-click table |
| Prevent errors | Inline validation, keep entered values | Form completion and field error rate | Form start and success events in a funnel |
Thresholds from Nielsen Norman Group, WCAG 2.2 and web.dev; metrics and events are suggestions to adapt to your own product.
How do you test feedback and speed?
Feedback and speed share one test: how long between the action and a visible reaction.
| Time after the action | What the person perceives | What the interface should do |
|---|---|---|
| Up to 0.1 s | Instant | Show the result; nothing extra |
| Up to 1 s | Noticeable, flow of thought intact | A pressed state or spinner is enough |
| Up to 10 s | Attention is at risk | Show that work is in progress |
| Over 10 s | Attention is lost | Show a progress indicator with an estimate, and let people leave and return |
To measure it, split the question in two. Browser responsiveness is the page's Interaction to Next Paint, read at the 75th percentile and compared with the 200 ms and 500 ms thresholds. Task latency is the time between your own two events, for example form_submit_click and form_submit_success. A page can pass the first and fail the second, because the second includes your server.
Decision rule: if the 75th percentile of task latency is over 1 second and the button shows no state change, add feedback first. Speeding up the server comes second, because feedback is cheaper and covers every case.
How do you test consistency, hierarchy and recognition?
These three have no standards document with a threshold, so test them with behavior instead:
- Hierarchy test. Open the click distribution for the page and find the most clicked element. If it is not the primary action, the hierarchy is not doing its job. Count how many elements get a meaningful share of clicks; more than two or three on a single task screen usually means competing emphasis.
- Consistency test. Pick one component that appears on many pages, such as the primary button or the search box, and compare its click-through across pages. A large gap between pages with the same component often means it looks different or sits somewhere else on those pages.
- Recognition test. Look at the paths people take to reach a page that is one click from the menu. Many people reaching it through site search or back-and-forth between pages suggests labels are not recognizable.
Decision rule: change one thing per page at a time, and write down the metric you expect to move before you ship. Moving the button and rewriting its label together leaves you unable to say which one worked.
Is the text legible? A contrast calculation
Contrast is the only principle here you can test with arithmetic and no users. WCAG defines the ratio as (L1 + 0.05) ÷ (L2 + 0.05), where L1 is the relative luminance of the lighter color and L2 of the darker one, each on a 0 to 1 scale. The ratios are thresholds, not rounded values: 4.499:1 fails.
Sample data, computed with the WCAG formula, on a white (#FFFFFF) background:
| Text color | Contrast with white | Normal text (4.5:1) | Large text (3:1) |
|---|---|---|---|
| #999999 | 2.85:1 | Fails | Fails |
| #8A8A8A | 3.45:1 | Fails | Passes |
| #767676 | 4.54:1 | Passes | Passes |
| #595959 | 7.00:1 | Passes | Passes |
Two takeaways. First, #767676 is the lightest pure gray that passes on white, so light gray placeholder and hint text is the usual offender. Second, white text on a mid-blue button such as #4F8CFF has a ratio of 3.22:1, which passes only if the label is large text. Darkening the button to #1D4ED8 gives 6.70:1.
How to apply it: list your text and background color pairs once, compute each ratio, and fix every normal-size pair under 4.5:1. This is a static check; no analytics tool produces it, so put it in design review.
Are the click targets big enough?
WCAG 2.2 criterion 2.5.8 asks for pointer targets of at least 24 by 24 CSS pixels. A smaller target passes if the spacing is large enough that a 24-pixel circle centered on it does not touch another target, or if the same function is available through another control that is big enough. Targets inside a sentence and controls drawn by the browser are exempt.
The behavioral signal is a frustration click: several fast clicks on the same element (a rage click), or a script error within a second after a click (an error click). TapCub's definition for the errors page is a rate per 1,000 pageviews: (rage clicks + error clicks) ÷ pageviews × 1,000.
Sample data for one page, before and after enlarging a 20-pixel icon button to 44 pixels:
| Pageviews | Rage clicks | Error clicks | Rate per 1,000 pageviews | |
|---|---|---|---|---|
| Before | 8,000 | 36 | 12 | (36 + 12) ÷ 8,000 × 1,000 = 6.0 |
| After | 8,000 | 14 | 10 | (14 + 10) ÷ 8,000 × 1,000 = 3.0 |
The rate halved. Note which part moved: rage clicks fell from 36 to 14, which is what a size change should affect, while error clicks barely changed, which says they have a different cause. Reading the two columns separately keeps you from claiming credit for the wrong fix.
Decision rule: any control under 24 pixels on a page with more than a handful of rage clicks is the first thing to enlarge; any page with many error clicks needs a developer, not a designer.
Worked example: does a form redesign actually help?
Error prevention and recovery are tested with form completion. Take a sign-up form where 3,000 people start filling in each period. The redesign adds inline validation (so errors appear as you type, not after submit), keeps typed values after an error, and writes error messages that say what to change.
Sample data:
| Started | Completed | Completion rate | |
|---|---|---|---|
| Before | 3,000 | 1,260 | 42.0% |
| After | 3,000 | 1,410 | 47.0% |
The difference is 5.0 percentage points, a relative gain of 11.9%. To check that it is not noise, use the two-proportion z-test in the NIST/SEMATECH handbook. The pooled rate is (1,260 + 1,410) ÷ 6,000 = 44.5%; the standard error is √(0.445 × 0.555 × (1/3,000 + 1/3,000)) = 0.0128; z = 0.05 ÷ 0.0128 = 3.90, a two-sided p-value of about 0.0001. A gap this size is very unlikely to be chance.
The test cannot tell you why. Before-and-after data is not a randomized comparison: a seasonal change, a different traffic mix or a marketing push in the second period would produce the same numbers. Check that traffic sources and device mix were similar in both periods, and keep the redesign as the only change on that page. If you need certainty, run a split test in a tool built for it and read the result with the method in the guide to statistical significance.
How many people do you need to test with?
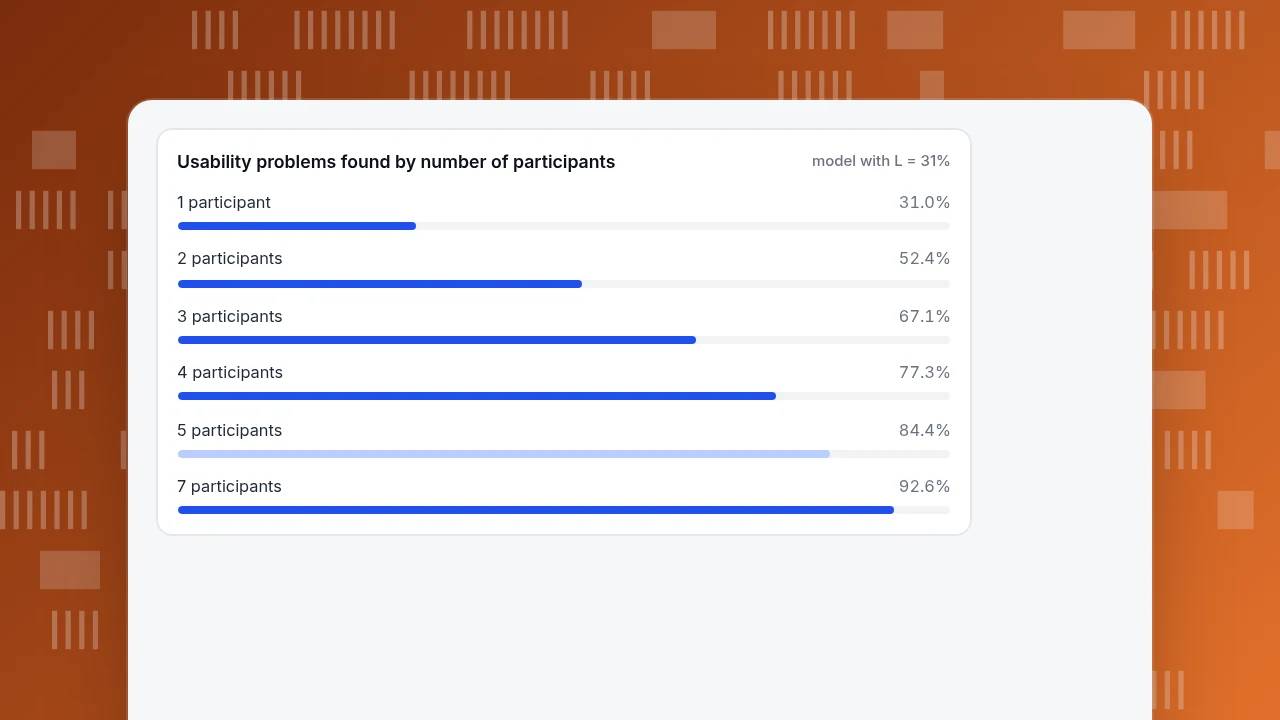
Analytics shows where people struggle; watching a few people shows why. Nielsen Norman Group's model for how many usability problems a test finds is N × (1 − (1 − L)^n), where N is the number of problems, L is the share found by one participant, and n is the number of participants. The typical L across the projects they studied was 31%.
Sample calculation with L = 31%:
| Participants | Share of problems found |
|---|---|
| 1 | 31.0% |
| 2 | 52.4% |
| 3 | 67.1% |
| 4 | 77.3% |
| 5 | 84.4% |
| 7 | 92.6% |
The curve flattens after five, so Nielsen's advice is to test with five, fix what you find, and test again with a new five rather than run one big round. L varies by product, so treat 31% as a typical value and not a guarantee.
Decision rule: when frustration clicks or a funnel drop point to a page, watch five sessions on that page before redesigning it.
Usability problems found by number of participants
model with L = 31%How do you check these principles in TapCub?
Suppose the sign-up form above is live and you want to know which of the eight principles it breaks. In TapCub the sequence is:
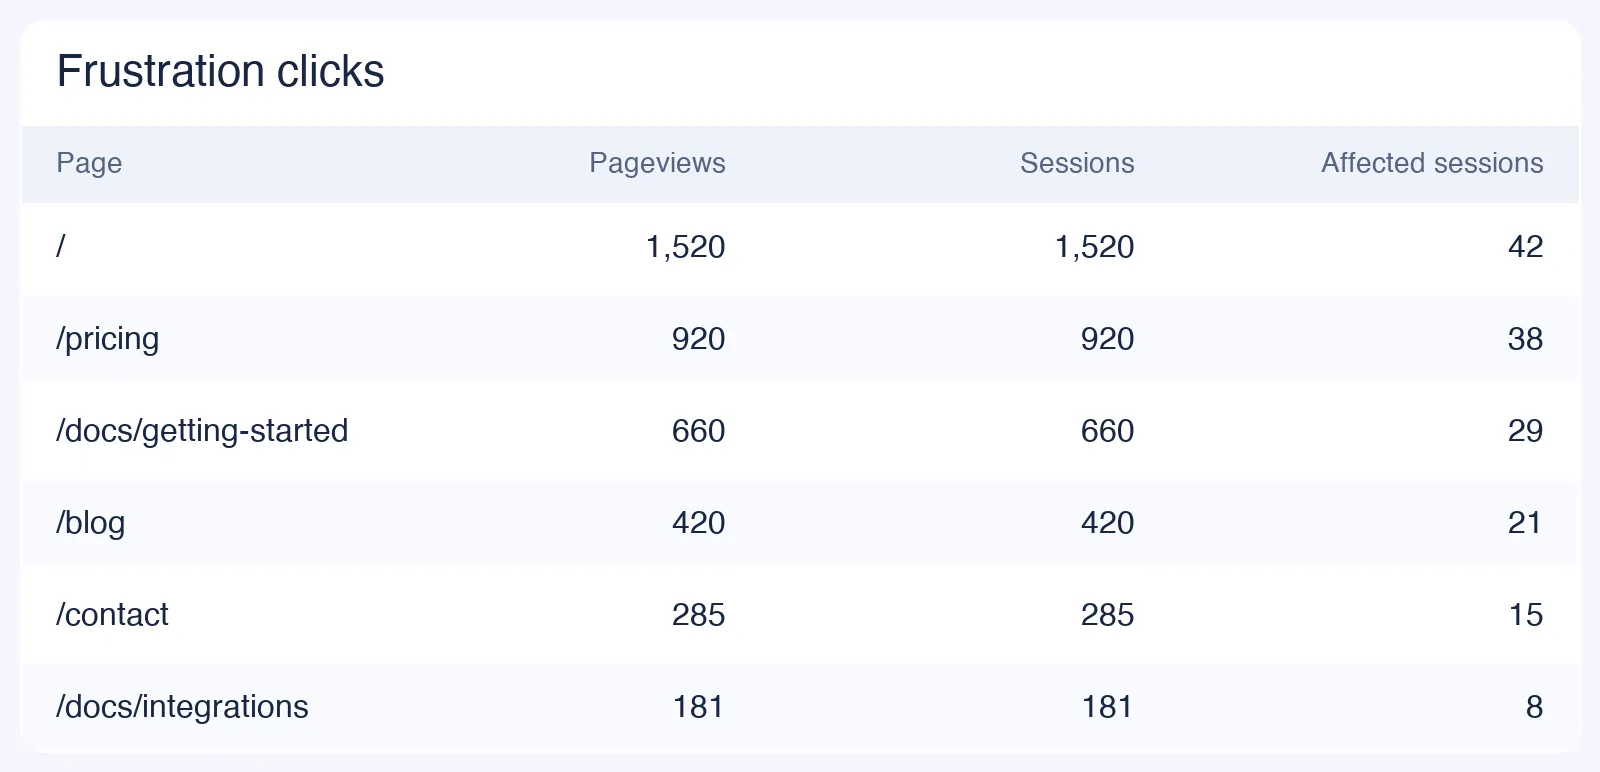
- Find the pages that frustrate people. Open Monitoring › Errors and read the frustration table. A page appears only if it has at least 20 pageviews and at least one rage click or error click, and the table gives the per-1,000 rate used in the targets example. This depends on autocapture, which the plan documentation lists as off on the Free plan and on from Pro.
- See which element gets the clicks. In All-platform analytics › Behavior › Heatmaps, pick the page, then use the Clicks, Rage clicks, Scroll reach and Elements tabs. The Elements table lists the most clicked controls and their share, which is the hierarchy test from earlier.
- Check responsiveness. Monitoring › Performance reports real-user Interaction to Next Paint against the 200 ms and 500 ms thresholds, with P75 as a card view and breakdowns by page, device and browser.
- Measure the form. In All-platform analytics › Behavior › Behavior analysis, build a funnel from the form-start event to the success event. It shows each step's count, the drop-off and the median time from the previous step, with the largest drop marked. Send the events with
tapcub.track()from your own code. - Watch a few sessions. All-platform analytics › Behavior › Session replay is off by default; when you turn it on, the default sample rate is 10% and input values are masked.
TapCub does not audit contrast or target size in your design files, run moderated usability tests, or split traffic between two designs. It measures what happened on the live page, and you decide what to change.
What mistakes make UI metrics misleading?
- Judging a redesign on one number. A completion rate that rises while error clicks also rise means more people got through by trying harder. Pair an outcome metric with a friction metric.
- Comparing periods that are not alike. A launch week and an ordinary week have different visitors. Compare like with like, or split by source first.
- Counting bot traffic as users. Automated visits with no clicks dilute every per-pageview rate. Separate them before computing rates.
- Treating a threshold as a goal. Passing 4.5:1 or 24 pixels means the minimum is met, not that the design is good.
- Reading small samples. The frustration table needs at least 20 pageviews to list a page, and a rate built on 20 pageviews moves with every click. Wait for a few hundred before acting.
FAQ
What are the principles of user interface design?
A practical set is: show system status, respond quickly, be consistent, keep hierarchy clear, let people recognize rather than recall, keep text legible, make targets large enough, and prevent errors. Most come from Nielsen's ten usability heuristics, and the legibility and target-size rules come with numeric thresholds from WCAG 2.2.
What is the difference between UI and UX design?
UI design covers what people see and touch: controls, layout, type, color and feedback. UX design covers the whole experience, including whether the product solves the problem at all. If people use the interface correctly and still fail, the problem is UX; if they cannot find, read or operate something, it is UI.
How do you measure whether a UI change worked?
Choose a metric and an event before the change, for example form completion between a start event and a success event, or frustration clicks per 1,000 pageviews. Compare equal periods, check the difference with a two-proportion test, and watch a friction metric alongside the outcome.
How many users do you need for UI testing?
Five is the usual starting point. Nielsen Norman Group's model, with an average of 31% of problems found per participant, predicts about 84% of problems from five people. Fix what you find and run another round with new participants rather than adding to the first.
What contrast ratio does text need?
WCAG 2.2 requires at least 4.5:1 for normal text and 3:1 for large text, which is 18 point or 14 point bold. Gray #767676 on white is 4.54:1, the lightest pure gray that passes. A computed 4.499:1 does not meet the requirement.
Sources
- Nielsen Norman Group, 10 Usability Heuristics for User Interface Design, published 1994, last reviewed 2024-01-30; and Response Times: The 3 Important Limits (0.1 s, 1 s, 10 s).
- W3C, Understanding SC 1.4.3 Contrast (Minimum) and Understanding SC 2.5.8 Target Size (Minimum), WCAG 2.2. Checked 2026-11-20.
- web.dev, Interaction to Next Paint (INP) (200 ms and 500 ms thresholds, 75th percentile). Checked 2026-11-20.
- Nielsen Norman Group, Why You Only Need to Test with 5 Users, 2000 (L = 31%).
- NIST/SEMATECH e-Handbook of Statistical Methods, Do two processes produce the same proportion of defectives? (two-proportion z-test).
Was this article helpful?
We use your answers to fix and expand this page.
Couldn’t send. Please try again in a minute.
Thanks for the feedback. We’ll use it to improve this page.You’ve already sent feedback on this page. Thanks.

Technical Engineer
Focuses on tracking code, SDKs, and API integrations, with practical guidance on implementation checks and troubleshooting.