Try it on your own data
Every report in this article is in the free plan. One snippet for web and apps, up to 10 sites.
Start freeA user engagement platform measures how people use your site or app and acts on it through messaging, in-app guidance, live chat or experiments. Which capabilities you need depends on the use case: in the sample scoring below, a full suite wins for SaaS onboarding (3.6 against 2.0) while analytics plus live chat wins for an online shop (3.5 against 3.3). Then check the price against the lift it must deliver.
What you will learn
- Judge by capabilities and the metric each should move, not by the product category label
- Set weights from your use case before looking at vendors; the winning setup changes with the use case
- Convert price to a break-even lift: $1,500 a month at $24 margin per order needs 62.5 extra orders, or 6.25% on 1,000 orders
What is a user engagement platform?
A user engagement platform is software that helps you see how people use your site or app and then act on it: send a message, show a guide, answer a question in chat, or change an experience. In practice the label covers up to four capability families that vendors bundle in different ways: messaging (email, push, SMS), in-app guidance (tours, banners, checklists), live chat and support and analytics (the measurement that tells you whom to message and whether it worked). The glossary entry on user engagement defines the underlying idea, and engagement metrics lists what to measure. This article is for the buying question: which capabilities do you need for your use case, and what lift would pay for them?
One caution before the table: no product does everything equally well, and "engagement platform" on a vendor page can mean any one family with the others bolted on. Judge by capabilities, not by the label.
Which capabilities do you need for which use case?
| Capability | What it does | Use cases where it matters most | How you know it worked |
|---|---|---|---|
| Messaging (email, push, SMS) | Reaches people outside your site | Win-back, onboarding sequences, order updates | Return visits and conversions from message-tagged sessions |
| In-app guidance | Shows tours, tips and checklists inside the product | SaaS onboarding, feature adoption | Activation rate, feature-use rate |
| Live chat and support | Answers questions at the moment of doubt | Ecommerce, lead generation, pricing pages | Chat-started conversion, resolution rate |
| Analytics | Measures behaviour, segments people, shows funnels and retention | Every use case, as the base layer | Whether any other row moved a metric |
| Feedback and surveys | Asks people directly | Satisfaction, churn reasons | Response rate and score changes |
| Personalization and experiments | Changes what people see and compares versions | Mature sites with traffic to test | Lift against a holdout |
Read the table from the right-hand column. A capability earns its place only when you can name the metric it should move. Analytics sits in every row because every other row depends on it: you cannot target, and you cannot prove a lift, without measurement.
| Capability | Use cases where it matters most | How you know it worked |
|---|---|---|
| Messaging (email, push, SMS) | Win-back, onboarding sequences, order updates | Return visits and conversions from message-tagged sessions |
| In-app guidance | SaaS onboarding, feature adoption | Activation rate, feature-use rate |
| Live chat and support | Ecommerce, lead generation, pricing pages | Chat-started conversion, resolution rate |
| Analytics | Every use case, as the base layer | Whether any other row moved a metric |
| Feedback and surveys | Satisfaction, churn reasons | Response rate and score changes |
| Personalization and experiments | Mature sites with traffic to test | Lift against a holdout |
Analytics is the base layer: it is how you target and how you prove any of the other rows worked.
How do you measure engagement before you buy anything?
Establish a baseline with three numbers you can compute in whatever analytics you already use:
- Engagement rate = engaged sessions ÷ all sessions. In Google Analytics 4, a session is engaged if it lasts longer than 10 seconds, has a key event, or has two or more page or screen views. Sample data: 5,400 engaged of 10,000 sessions = 54%.
- Stickiness = daily active users ÷ monthly active users. Sample data: 1,800 ÷ 9,000 = 20%, meaning an average user is active on about 6 days of a 30-day month (0.20 × 30).
- Return rate = share of visitors who come back within 30 days.
Sample data for the return rate: of 12,000 visitors in a month, 3,000 come back within 30 days, so the return rate is 3,000 ÷ 12,000 = 25%. If email-sourced visitors return at 40% and paid-social visitors at 12%, the average hides a threefold gap, and that gap is the evidence for or against adding a messaging channel. Always cut these by source, device and first-visit versus return. A blended 54% can hide a 70% from email and 35% from paid social, and that gap tells you where a messaging tool would help or not. If you cannot get the cut yet, that is the first thing to fix: analytics is the cheapest and most informative row in the table.
How do you compare platforms for your use case?
Use a weighted score, with weights set by your use case before you look at any vendor. Sample data: three setups scored 0 to 5 on four capabilities.
| Setup | Messaging | In-app | Live chat | Analytics |
|---|---|---|---|---|
| All-in-one suite | 4 | 4 | 3 | 3 |
| Analytics plus live chat | 0 | 0 | 5 | 5 |
| Messaging only | 5 | 3 | 0 | 1 |
Two use cases, two sets of weights:
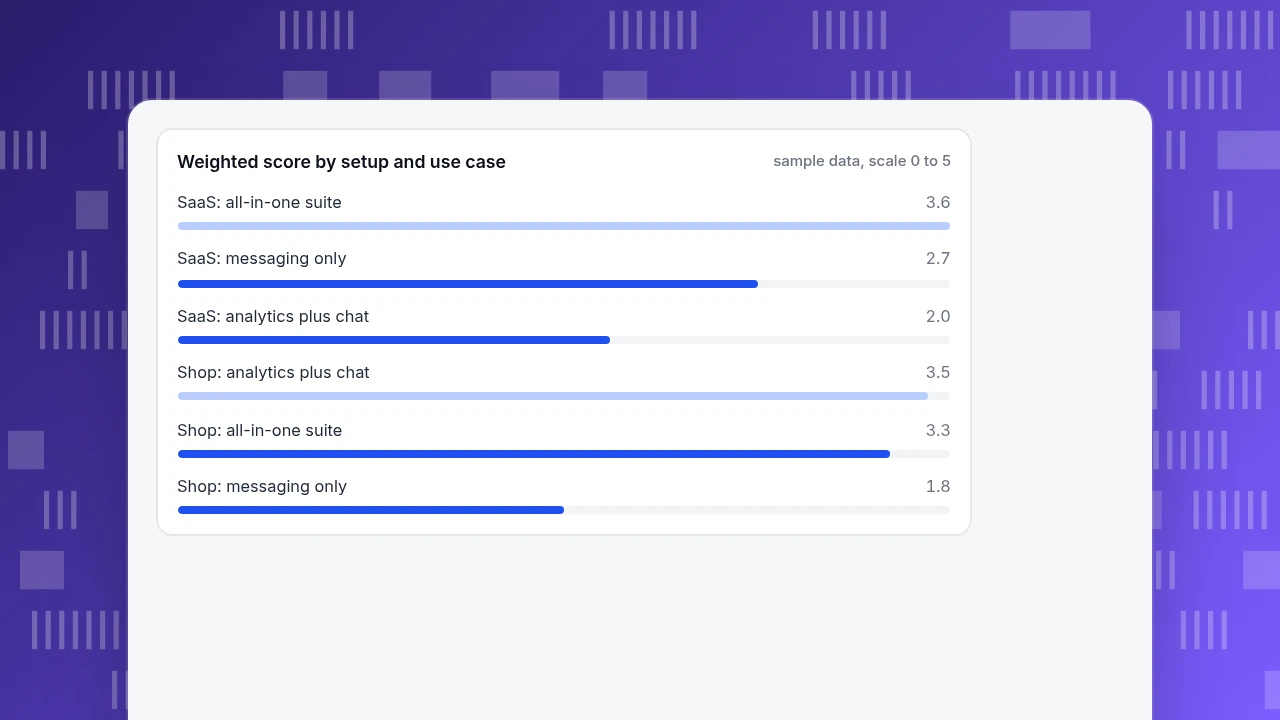
- SaaS onboarding and churn (messaging 30%, in-app 30%, chat 10%, analytics 30%). Suite: 4 × 0.3 + 4 × 0.3 + 3 × 0.1 + 3 × 0.3 = 3.6. Analytics plus chat: 0 + 0 + 0.5 + 1.5 = 2.0. Messaging only: 1.5 + 0.9 + 0 + 0.3 = 2.7.
- Online shop conversion (messaging 25%, in-app 5%, chat 30%, analytics 40%). Suite: 1.0 + 0.2 + 0.9 + 1.2 = 3.3. Analytics plus chat: 0 + 0 + 1.5 + 2.0 = 3.5. Messaging only: 1.25 + 0.15 + 0 + 0.4 = 1.8.
The winner changes with the use case, which is the point: the right choice for onboarding a software product is not the right choice for a store. Write the weights down and share them before the trials start, so nobody can adjust them afterwards to favour a product they already like. Weights should sum to the whole, and no single capability should carry more than 40% unless the use case really is that narrow. Change the weights and the scores to match what you saw in a trial.
Weighted score by setup and use case
sample data, scale 0 to 5What lift does a platform need to deliver to pay for itself?
Convert the monthly price into orders. Sample data: the platform costs $1,500 a month, each extra order is worth $24 of gross margin ($60 order at 40%), and the site gets 50,000 sessions a month at a 2.0% conversion rate, which is 1,000 orders.
- Orders needed to break even: $1,500 ÷ $24 = 62.5.
- Relative lift needed: 62.5 ÷ 1,000 = 6.25%, which means moving conversion from 2.00% to about 2.13%.
Now ask whether the capability can plausibly deliver that on your traffic. A 6% lift from live chat answering pricing questions is believable; a 6% lift from a monthly newsletter alone is a harder claim. If the break-even lift is above what you could defend to finance, start with the cheaper row. And remember to prove the lift with a comparison group: people who use engagement features are usually more engaged to begin with.
What should a 30-day pilot prove?
Before you commit to a platform, run a pilot with a written pass mark, so the decision does not depend on the demo.
- Fix the metric and the target. Sample data: engagement rate is 54% today and the pilot should lift it to 57% for the group that receives the new feature.
- Size the groups. Detecting 54% against 57% at 80% power and 5% significance needs about 4,300 sessions per group. If your traffic cannot supply that in 30 days, extend the pilot or choose a bigger metric such as conversion for a high-volume page.
- Keep a holdout. The group without the feature is what makes the result a measurement.
- Ask the data questions up front. Can you export raw events? Does the tool use your visitor or user ID, or its own? What happens to the data if you leave? A platform that traps identity makes every later switch costlier.
- Write the pass mark. For example: "at least +3 points engagement, no rise in unsubscribes, set-up under 10 working days." Decide after the pilot only whether it was met.
What rules apply once you can message people?
Messaging changes your legal exposure, so check the basics before you scale. In the United States, the FTC's CAN-SPAM guide says you must honour a recipient's opt-out request within 10 business days and include a valid physical postal address in commercial email. Other regions add consent requirements, so check the law of the places your recipients live. A platform that makes opting out difficult is a risk, whatever its feature list says.
How does TapCub fit into an engagement stack?
TapCub is the measurement and live-chat layer of that table, not the messaging layer. TapCub does not send email, push or in-app messages, and does not run campaigns or journeys; it measures what happens and answers visitors in chat. Using the online-shop case above:
- Baseline the audience. Open All-platform analytics › Behavior › Behavior analysis to see funnels and retention, and Web analytics › Sources to cut engagement by channel.
- Build the segments. In All-platform analytics › Users › Segments & tags create rule segments, such as people who viewed pricing and did not buy. The same segment can be used as a group in funnel and retention analysis. Anonymous visitors have no profile and do not enter segments; identified users do.
- Answer at the moment of doubt. Turn on live chat from Live chat › Chat settings › Appearance, and set Live chat › Chat settings › Proactive invites to trigger on a page plus a number of seconds. Each conversation arrives with the visitor's source and recent pages, because analytics and chat share one script and one visitor ID.
- Measure the lift. Live chat › Reports › Conversion attribution compares visitors who chatted with those who did not, and warns when fewer than 30 chatted. Treat the gap as an upper bound, for the reason in the previous section.
- Hand off to messaging. If you decide you need email or push, choose that tool separately and keep TapCub for measuring the sessions it sends back.
FAQ
What is a user engagement platform?
Software that helps you measure how users interact with your site or app and act on it, through messaging, in-app guidance, live chat or experiments. Most products specialise in one or two of these families, so compare capabilities.
What is the difference between an engagement platform and analytics?
Analytics measures and segments behaviour; an engagement platform adds actions such as messages and guides. You need the measurement either way, so many teams start with analytics and add actions where the data shows a gap.
How do you measure user engagement?
Start with engagement rate, stickiness and return rate, cut by source. In Google Analytics 4 a session is engaged if it lasts over 10 seconds, has a key event or has two or more views.
How much should an engagement platform cost?
Work backwards from break-even: price divided by margin per extra order, divided by current orders. In the sample, $1,500 a month needs a 6.25% lift. If you cannot defend that lift, pick a cheaper capability first.
Do you need one platform or several tools?
It depends on the weights for your use case. In the sample, one suite won for SaaS onboarding while analytics plus chat won for a shop. Integration effort and data consistency matter as much as the feature count.
Sources
- Google, Analytics Help: Engagement rate and engaged sessions: an engaged session lasts over 10 seconds, has a key event or has 2 or more views (checked 2026-11-20).
- Federal Trade Commission, CAN-SPAM Act: A Compliance Guide for Business: opt-outs honoured within 10 business days; valid physical postal address required (checked 2026-11-20).
Was this article helpful?
We use your answers to fix and expand this page.
Couldn’t send. Please try again in a minute.
Thanks for the feedback. We’ll use it to improve this page.You’ve already sent feedback on this page. Thanks.

Product Adoption Consultant
Explores customer onboarding, live conversations, and self-service, turning common usage questions into practical guidance and improvements.