Try it on your own data
Every report in this article is in the free plan. One snippet for web and apps, up to 10 sites.
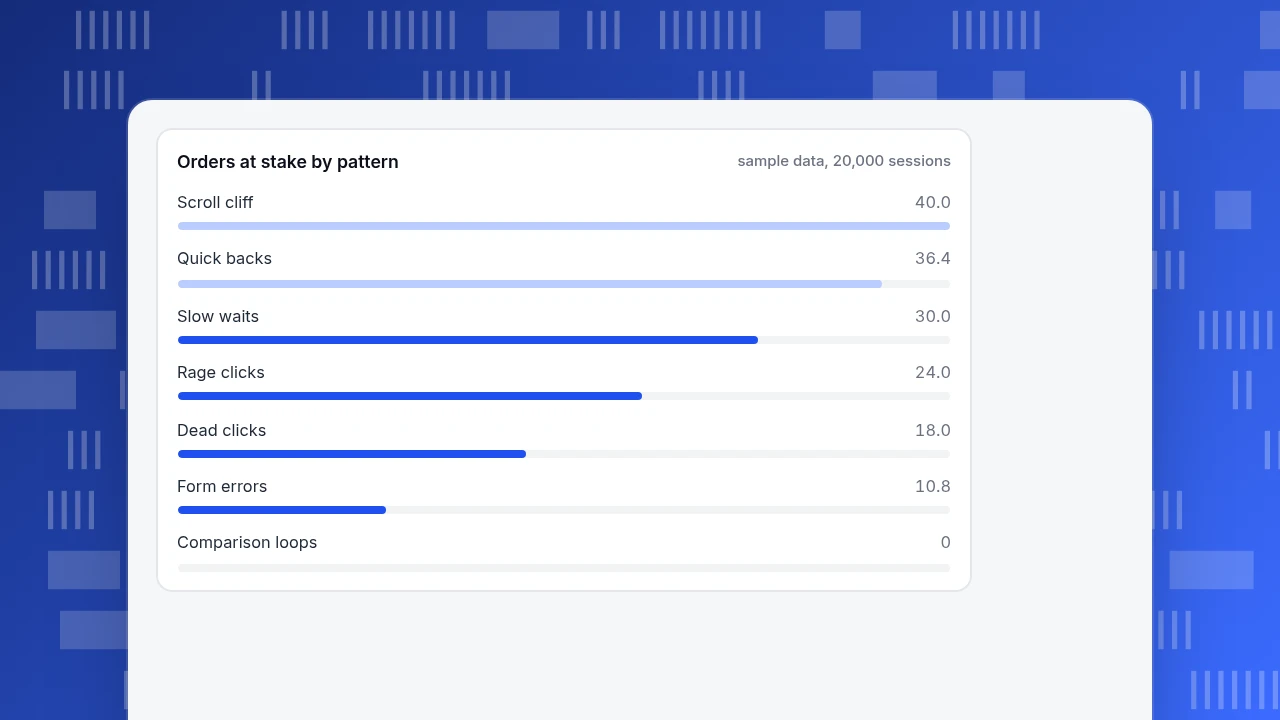
Start freeThe user behavior patterns worth checking on every site are rage clicks, dead clicks, quick backs, scroll cliffs, form abandonment, comparison loops and slow waits. Each has a metric that reveals it, such as sessions with a rage click divided by sessions. Rank what you find by orders at stake, not by how annoying it looks: in the sample, the scroll cliff (40 orders) outranked rage clicks (24).
What you will learn
- Seven patterns cover most friction; each has one metric that exposes it by page and element
- Rank patterns by orders at stake (affected sessions x conversion gap), not by how irritating they look
- Sessions carry several patterns at once, so do not add the orders-at-stake column; fix the top row and recompute
What are the seven user behavior patterns worth looking for, and what metric reveals each?
Most user behavior patterns that matter on a website show up as a repeated action that costs the visitor time or patience. Seven are common enough to check on every site. Each has a name, a plain-language meaning and a metric that exposes it in your analytics. For a wider look at the discipline, see behavioral analytics and user behavior tracking; this article is the field guide.
| # | Pattern | What the visitor does | Metric that reveals it |
|---|---|---|---|
| 1 | Rage clicks | Clicks the same spot several times, fast | Sessions with a rage click ÷ sessions, by page and element |
| 2 | Dead clicks | Clicks something that does nothing | Dead clicks per 1,000 views, by element |
| 3 | Quick backs (on-site pogo-sticking) | Opens a page and returns within seconds | Returns to the previous page within a few seconds ÷ page views |
| 4 | Scroll cliff | Stops scrolling long before the content ends | Share of views reaching 25%, 50% and 75% scroll depth |
| 5 | Form abandonment | Starts a form and leaves, often after errors | Starts to completions, plus error rate per field |
| 6 | Comparison loops | Moves back and forth between the same few pages | Repeat views of the same pages per session |
| 7 | Slow-response waits | Waits for the page to react, then repeats the action | Interaction to Next Paint at the 75th percentile |
Patterns overlap, so one session can carry several. That matters when you prioritise, which the worked example below covers.
| Pattern | Metric that reveals it | Where to look first |
|---|---|---|
| Rage clicks | Sessions with a rage click ÷ sessions, by element | Click heatmap, then recordings |
| Dead clicks | Dead clicks per 1,000 views, by element | Click heatmap |
| Quick backs | Returns to the previous page within seconds ÷ views | Path from listing to detail page |
| Scroll cliff | Share reaching 25%, 50%, 75% depth | Scroll heatmap |
| Form abandonment | Starts to completions, error rate per field | Goal funnel and error log |
| Comparison loops | Repeat views of the same pages per session | Path analysis |
| Slow waits | Interaction to Next Paint, 75th percentile | Real-user performance |
Measure each pattern per element or page; a site-wide rate hides the one thing causing it.
Rage clicks and dead clicks: what do they tell you?
Microsoft's Clarity documentation describes a rage click as a user clicking multiple times in a clustered area in rapid succession, and calls it a strong indicator of frustration where users expect an element to be interactive. A dead click is a click where the user gets no feedback in a reasonable time: nothing visibly changes and the page does not navigate. The same documentation says a dead click can point to broken elements, slow requests or misleading design.
Both are measured per element. A site-wide rate hides the one image, icon or button that causes most of them. Check them in a click heatmap first, then confirm in a few recordings:
- Rage clicks on a non-link (an image, a heading, a price): the visitor expects it to be interactive. Make it so, or make it look static.
- Rage clicks on a real button: it is slow or broken. Check errors and performance for that page.
- Dead clicks on a decorative element (a badge, a card): decide whether it should link.
What is a quick back, and is it the same as pogo-sticking?
Pogo-sticking is the habit of jumping from a search result to a page and straight back to try another. Your own analytics cannot see that search-results step, but it can see its on-site twin: a visitor opens a product or article page from a listing and returns within a few seconds. Clarity names this a quick back, detected when a user returns in less time than a dwell threshold.
Measure it as quick backs ÷ views of the detail page, for each listing. A high rate means the listing promised something the page did not deliver: a misleading thumbnail, a price that changes, a title that overpromises. A low rate with low conversion points somewhere else. Do not treat every short visit as failure; a visitor who found the phone number on the page and left is a success.
What does a scroll cliff look like, and how steep is normal?
A scroll cliff is a sharp fall in the share of visitors reaching deeper parts of a page. Some drop-off is normal. The Nielsen Norman Group's 2018 eye-tracking study found 57% of viewing time was spent above the fold and a further 17% on the second screenful, so the top two screens received about 74%. The sharp fall-off after the fold matched its 2010 study, even though the share above the fold had dropped from about 80%.
Use it as a reference, not a target. Plot the share reaching 25%, 50% and 75% depth. As a working rule (ours, not a published standard), call it a cliff when the drop is 30 percentage points or more between two adjacent depths on a page where the important content lies past the drop. Then check whether the content before it looks finished: a full-width banner or an empty-looking gap can fake an end of page.
How do form abandonment and comparison loops show up?
Form abandonment is measured two ways: starts to completions, and the error rate for each field. Sample data: 900 sessions start a form and 60% of them hit a validation error on one field. That field, not the whole form, is the pattern. The cure is usually inline guidance or removing the field.
Comparison loops are visitors who bounce between the same three or four pages, such as two plans and the pricing table, before leaving or buying. They convert better than average in the sample below, so a loop is not a leak. It is a sign the shopper is comparing and your pages do not do the comparing for them. A side-by-side comparison table on one page often shortens the loop.
Slow waits: why do they create rage and dead clicks?
A page that does not respond makes people click again. Google's web.dev defines good Interaction to Next Paint as 200 milliseconds or less at the 75th percentile of page loads, needs-improvement as above 200 up to 500, and poor above 500. If a rage-click cluster sits on a working button, check the interaction speed for that page before you redesign it. Fixing the delay removes the symptom, and a redesign would not.
How do you rank the patterns that you find?
Count the orders at stake rather than the number of occurrences. Sample data: 20,000 sessions, baseline conversion 3.0% for sessions with none of these patterns. For each pattern, orders at stake = affected sessions × (3.0% − their conversion rate). Treat the result as an upper bound, because affected sessions may never have bought.
| Pattern | Affected sessions | Share of 20,000 | Their conversion | Orders at stake |
|---|---|---|---|---|
| Rage clicks | 1,200 | 6.0% | 1.0% | 24.0 |
| Dead clicks | 3,000 | 15.0% | 2.4% | 18.0 |
| Quick backs | 2,600 | 13.0% | 1.6% | 36.4 |
| Scroll cliff (under 25% depth) | 5,000 | 25.0% | 2.2% | 40.0 |
| Form errors | 900 | 4.5% | 1.8% | 10.8 |
| Slow waits | 2,000 | 10.0% | 1.5% | 30.0 |
| Comparison loops | 1,500 | 7.5% | 3.9% | 0 (above baseline) |
The most irritating pattern, rage clicks at 6.0% of sessions, is not the one at the top. The scroll cliff and quick backs put more orders at stake simply because they touch more sessions. Because sessions can carry several patterns, do not add the column: 159.2 would overstate it. Fix the top row, then recompute.
Orders at stake by pattern
sample data, 20,000 sessionsHow often should you check, and how much data do you need?
Rare patterns need a longer window. To see whether a fix halves the rage-click share from 6.0% to 3.0%, a standard two-proportion calculation at 80% power and 5% significance needs about 750 sessions per period. To see form errors fall from 4.5% to 2.25% you need about 1,000 form sessions per period. A weekly look is fine for a busy page; for a quieter page, aggregate by month so a handful of sessions does not swing the rate.
Record the sample size next to every rate you report, so a reader can tell 6.0% of 20,000 sessions from 6.0% of 200. A routine that works: check the heatmap and the seven rates weekly for your top five pages, re-rank monthly using orders at stake, and keep a short log of what you changed and the date, so a later dip can be tied to a release.
How do you find these patterns in TapCub?
Use the table above as a weekly checklist:
- Click patterns. Open All-platform analytics › Behavior › Heatmaps for a key page and read the click, rage-click, scroll and element views. Scroll depth gives you the cliff; rage clicks give you pattern 1.
- Confirm with recordings. Open All-platform analytics › Behavior › Session replay to watch a handful of sessions around the hot spot. Session replay is off by default, so enable it first; it records new sessions only.
- Quick backs and loops. In All-platform analytics › Behavior › Behavior analysis use the path view from a listing to its detail pages to see how many return at once, and how often visitors cycle between the same pages.
- Forms and delays. Check Monitoring › Errors for the page and Monitoring › Performance for real-user speed; define the form's completion as a goal in Web analytics › Goals.
- Rank and recheck. Compute orders at stake as above with your goal conversion, and mark the day you ship the fix in Configuration › Annotations.
TapCub reports what visitors did; it does not decide which pattern is a problem for your business or make the fix. Bots and AI crawlers are counted separately, so their clicks never become rage-click data.
FAQ
What are user behavior patterns?
Repeated actions that show how people use a site, such as rage clicks, dead clicks, quick backs, scroll cliffs, form abandonment, comparison loops and slow waits. Each has a metric in your analytics that reveals it.
What is a rage click?
Several fast clicks in the same spot, a sign that the visitor expected something to respond. Clarity describes it as a strong indicator of frustration. Look at where it happens by element before deciding on a fix.
What is pogo-sticking?
Jumping from a search result to a page and straight back to try another. Site analytics cannot see the search step, but an on-site equivalent, the quick back from a listing to a detail page, can be measured.
How do you find user behavior patterns in analytics?
Start from the seven metrics above, rank by orders at stake and confirm the top two in heatmaps and recordings. Do this weekly, not once.
Which pattern should I fix first?
The one with the most orders at stake, which is not always the most frustrating one. In the sample, the scroll cliff (40 orders) outranked rage clicks (24) because it touched more sessions.
Sources
- Microsoft Learn, Clarity semantic metrics: definitions of rage clicks, dead clicks and quick backs (checked 2026-11-20).
- Nielsen Norman Group, Scrolling and Attention: 57% of viewing time above the fold, 17% on the second screenful, 2018 study (checked 2026-11-20).
- web.dev, Interaction to Next Paint: INP thresholds of 200 ms and 500 ms (checked 2026-11-20).
Was this article helpful?
We use your answers to fix and expand this page.
Couldn’t send. Please try again in a minute.
Thanks for the feedback. We’ll use it to improve this page.You’ve already sent feedback on this page. Thanks.

Product Experience Specialist
Writes about product experience, practical workflows, and growth, turning complex processes into clear steps for everyday decisions.