Try it on your own data
Every report in this article is in the free plan. One snippet for web and apps, up to 10 sites.
Start freeTo use data to improve customer experience, find a signal in your analytics, name a cause you can test, ship the smallest fix and measure the same metric again. Each fix below pairs a signal with a fix and a result: checkout completion up 10.5%, rage-click sessions down 65%, signup completion up 17.3%. Every number is sample data with the arithmetic shown.
What you will learn
- Every improvement is four steps: signal, cause, fix and a check on the same metric afterwards
- Put a number on each result and say what would make it believable: sample size, equal periods, a release marker
- Treat assumed effects, like orders from rescued searches, as upper bounds and plan on about half
What does using data to improve customer experience look like?
It looks like a repeated four-step loop: a signal in your data (a drop, a spike, a pattern), a cause you can name, a fix you ship, and a check that the same metric moved afterwards. Anything that skips the cause or the check is reporting, not improvement. For the dashboards and indicators that feed the loop, see customer experience analytics and customer experience metrics; this article is about the part those pages stop short of, which is what to change and what the change was worth.
The six examples below all use sample data from an imaginary online shop. Each one names the signal, the fix and the number that proves it.
| # | Signal | Fix | Metric that moved |
|---|---|---|---|
| 1 | Shoppers leave at the payment step | Show a shipping estimate in the cart | Checkout completion |
| 2 | Mobile product pages load slowly | Cut page weight | Product-page conversion |
| 3 | Rage clicks on a product image | Make the image zoomable | Share of sessions with rage clicks |
| 4 | Many site searches return nothing | Add synonyms and redirects | Zero-result searches |
| 5 | One question floods live chat | Answer it on the product page | Chats on that topic |
| 6 | Signup form throws errors | Show the password rule up front | Form completion |
| Signal | Where to see it | Fix | Metric to check |
|---|---|---|---|
| Drop at the payment step | Funnel | Show a shipping estimate in the cart | Checkout completion |
| Slow mobile product pages | Real-user performance | Compress images and defer scripts | Product-page conversion |
| Rage clicks on an image | Click heatmap and replay | Make the image zoomable | Share of sessions with rage clicks |
| Zero-result searches | Search terms log | Add synonyms and redirects | Zero-result share of searches |
| One question floods chat | Chat topics and start pages | Answer it on the page | Chats on that topic |
| Signup form errors | Form error events | Show the rule next to the field | Form completion |
Pick the row with the most affected sessions first; the check column is the number you report.
The loop: signal, cause, fix, check
Use the same four questions every time, in this order:
- What exactly changed or looks wrong? Write one sentence with a number: "52% of signup starts complete."
- What is the most likely cause, and what would prove it? A guess is fine if you name the evidence that would confirm it: a replay, a heatmap, a support tag, an error log.
- What is the smallest fix that tests the cause? Smaller fixes are easier to attribute. Changing the shipping message is a cleaner test than redesigning checkout.
- What number says it worked, and how large a change would be believable? Decide this before you ship, not after.
For step 4, a quick rule of thumb: with around 8,000 sessions in each period, a two-point change in a 60% rate is comfortably beyond random noise, while a 0.2-point change is not. The test used later in this article, a two-proportion z-test, is a standard way to check this (see the NIST reference in Sources).
Example 1: shoppers leave at the payment step
Signal. Sample data: 8,000 checkout starts in a month, 4,560 completed, which is 4,560 ÷ 8,000 = 57.0%. A funnel shows the biggest drop between the delivery step and the payment step, where the shipping cost first appears.
Cause. Unexpected extra cost. In the Baymard Institute's compilation of 50 studies, the most common reason for abandonment among US shoppers who said they were not just browsing was extra costs being too high, at 40%.
Fix. Show a shipping estimate in the cart, before checkout begins.
Check. The next month: 8,000 starts, 5,040 completed, 63.0%. That is +6.0 percentage points, a relative gain of 63.0 ÷ 57.0 − 1 = 10.5%. A two-proportion z-test gives z ≈ 7.7, far beyond the 1.96 needed at the 5% level, so this is not noise. It is still a before-and-after comparison, so note anything else that changed that month, such as a promotion.
Example 2: mobile product pages load slowly
Signal. Real-user performance data shows mobile product pages failing Google's "good" threshold for Interaction to Next Paint, which is 200 ms or less at the 75th percentile according to web.dev.
Cause. Oversized images and third-party scripts competing for the main thread.
Fix. Compress and lazy-load images, defer the scripts that are not needed to buy.
Check. Sample data: product-page conversion before, 2,400 orders from 120,000 mobile sessions = 2.00%. After, 2,568 orders from 120,000 sessions = 2.14%. Relative gain 2.14 ÷ 2.00 − 1 = 7.0%, z ≈ 2.4.
For context, a study of mobile retail sites published on web.dev reported that a 0.1 second improvement in load time raised retail conversion by 8.4%. Treat that as a signal that speed matters, not as a forecast for your shop: it is an average over that study's sites, and your own measurement, 7.0% here, is the number that counts.
Example 3: rage clicks on a product image
Signal. Sample data: of 50,000 product-page sessions, 3,000 (6.0%) contain a rage click, meaning several fast clicks in the same spot. A click heatmap shows the cluster sits on the main product image. Microsoft's Clarity documentation describes rage clicks as a strong indicator that users expect an element to be interactive.
Cause. Shoppers try to zoom the image and nothing happens.
Fix. Make the image open a zoom view.
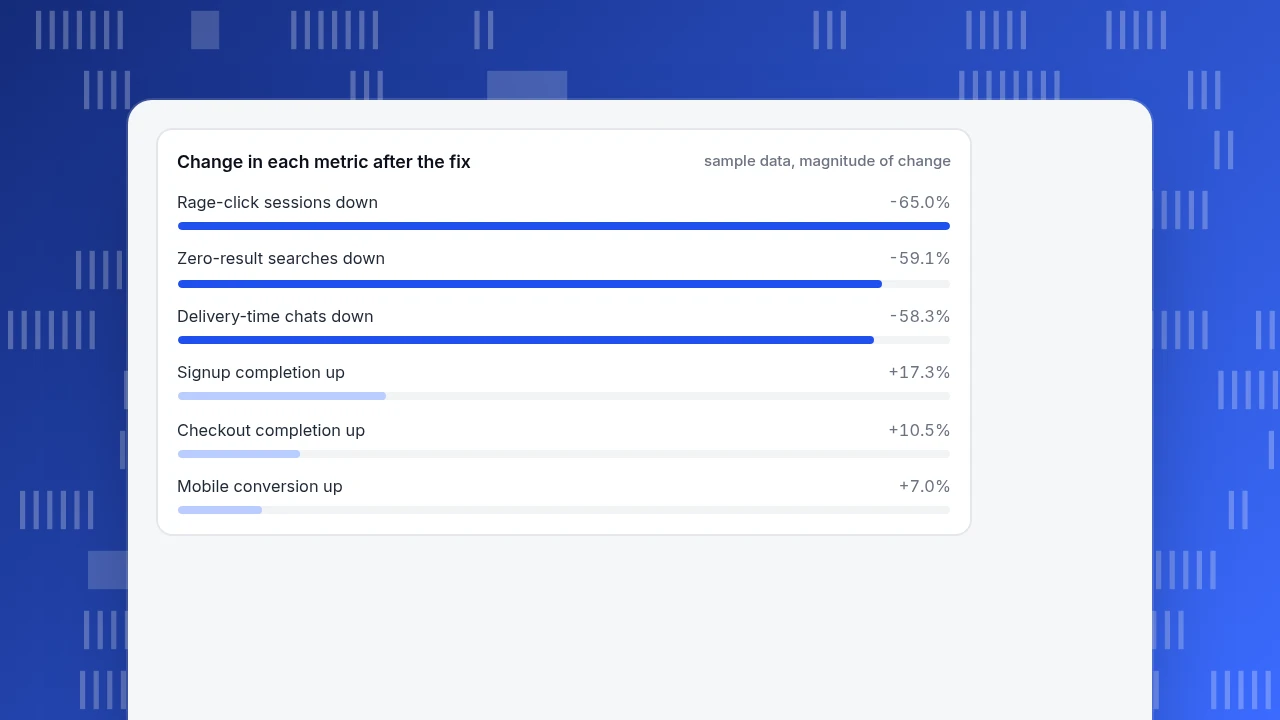
Check. One month later, 1,050 of 50,000 sessions (2.1%) contain a rage click, a drop of (1,050 ÷ 3,000) − 1 = −65.0%. To turn that into orders: suppose sessions with a rage click convert at 1.2% and other sessions at 3.1%. If the 1,950 sessions that no longer rage-click now convert like the rest, that is 1,950 × (3.1% − 1.2%) = 37.05, about 37 extra orders a month. That assumption is optimistic: these shoppers might never have bought, so treat 37 as an upper bound and check actual orders.
Change in each metric after the fix
sample data, magnitude of changeExample 4: many site searches return nothing
Signal. Sample data: 9,000 site searches a month, 22% with zero results, so 9,000 × 22% = 1,980 searches that end in a blank page.
Cause. Shoppers use words your catalogue does not, such as "sneakers" for "trainers."
Fix. Read the top zero-result terms, add synonyms, and redirect the rest to the closest category.
Check. Zero-result searches fall to 9%: 9,000 × 9% = 810. That moves 1,980 − 810 = 1,170 searches into results. If searches with results convert at 6% and zero-result searches at 0.5%, the full upside is 1,170 × (6% − 0.5%) = 64.35 orders. The newly rescued searches are probably weaker than average, so plan on half: about 32 orders.
Example 5: one question floods live chat
Signal. Sample data: 1,200 chats a month, and 30% of them, 360, ask how long delivery takes. Most start on product pages.
Cause. The delivery time is only visible at checkout.
Fix. Add a delivery estimate beside the buy button.
Check. Chats on that topic fall from 360 to 150, a drop of 58.3%. At a sample handling cost of $4.00 per chat ($28 an hour ÷ 7 chats an hour), 210 fewer chats save 210 × $4.00 = $840 a month. Also check that satisfaction did not fall: fewer chats is only good if the answer was found elsewhere.
Example 6: the signup form throws errors
Signal. Sample data: 5,000 form starts, 1,400 sessions (28%) with at least one validation error, 900 of them on the password field. Completion is 2,600 ÷ 5,000 = 52.0%.
Cause. The password rules appear only after a failed attempt.
Fix. Show the rules next to the field and validate as the person types.
Check. Error sessions fall to 700 (14%) and completion rises to 3,050 ÷ 5,000 = 61.0%: +9.0 points, a relative gain of 17.3%, z ≈ 9.1.
How do you know a fix worked and not noise?
Apply these rules to each result before you report it:
- Compare like with like. Same length of period, same traffic mix. If a promotion ran in one period, say so or exclude it.
- Mark the release date on your charts so a change in the trend can be tied to a change on the site.
- Check the sample. Under a few hundred sessions per period, wait.
- Look for a side effect. A fix that raises completion but raises refunds or support contacts is a transfer, not a gain.
- Use a holdout when you can. Showing the fix to half of visitors is the cleanest check; if you cannot, report it as before-and-after.
- Report ranges, not points. "About 32 orders, up to 64" is more honest than "64."
How to run this loop in TapCub
Take Example 3, the rage clicks, and run it with TapCub:
- Find the signal. Open All-platform analytics › Behavior › Heatmaps for the product page and read the click and rage-click views. A dense cluster on a non-link element is your cause candidate.
- Confirm with a recording. Open All-platform analytics › Behavior › Session replay. Session replay is off by default, so switch it on first; it records new sessions from that point.
- Size the problem. In Web analytics › Goals define the purchase goal, then use All-platform analytics › Behavior › Behavior analysis to see the funnel, and Monitoring › Errors and Monitoring › Performance for error and speed evidence on the same page.
- Mark the release. In Configuration › Annotations add a note on the day you ship the fix.
- Check the result on the same funnel a few weeks later, over the same length of period.
TapCub does not make the fix, run an A/B split or tell you the cause; it measures what visitors did before and after. Real visitors are counted separately from bots, so crawler traffic does not distort the rates you compare. If your shop also uses TapCub live chat, each conversation arrives with the visitor's source and recent pages, which helps with Example 5.
FAQ
How do you use data to improve customer experience?
Find a signal, name a cause you can test, ship the smallest fix and measure the same metric again over a comparable period. The examples above each end in a number such as a completion rate or an order count.
What data is most useful for improving customer experience?
Behavioural data (funnels, heatmaps, replays, errors, speed) shows what people did. Conversation data (support tags, chat topics) shows what confused them. Use both for each problem.
How much data do I need before acting?
A few thousand sessions per period is comfortable for rates between 20% and 80%. For rare events such as rage clicks, aggregate over a month and check the count, not just the percentage.
How do I prove the change caused the improvement?
You can only be sure with a holdout group that did not see the change. Otherwise compare equal periods, mark the release date and look for other changes. Say "before and after" in your report if that is what it is.
Which fix should I do first?
Sort by the number of affected sessions times the likely gain per session, then by effort. Example 1 affects 8,000 sessions a month, so it beats a fix that touches 500.
Sources
- Baymard Institute, Cart Abandonment Rate Statistics: average documented abandonment 70.22% across 50 studies; extra costs the top reason at 40% (page dated 28 October 2026, checked 2026-11-20).
- web.dev, Milliseconds make millions: 0.1 s mobile speed gain linked to +8.4% retail conversion (checked 2026-11-20).
- web.dev, Interaction to Next Paint: INP thresholds of 200 ms and 500 ms (checked 2026-11-20).
- Microsoft Learn, Clarity semantic metrics: definitions of rage clicks and dead clicks (checked 2026-11-20).
- NIST, Dataplot: binomial proportion test: pooled two-proportion test statistic (checked 2026-11-20).
Was this article helpful?
We use your answers to fix and expand this page.
Couldn’t send. Please try again in a minute.
Thanks for the feedback. We’ll use it to improve this page.You’ve already sent feedback on this page. Thanks.

Data Engineer
Writes about event design, data quality, and collection workflows, with verifiable implementation methods for reliable analytics.