Try it on your own data
Every report in this article is in the free plan. One snippet for web and apps, up to 10 sites.
Start freeWebsite benchmarks are only useful when they state who was measured, in which period, with which definition and at which percentile. In the Web Almanac 2024, 43% of mobile sites passed all three Core Web Vitals, the median mobile page weighed 2,311 KB, and returning visitors converted at 2.9% against 1.7% for new ones. Use the table below, and re-weight to your own traffic mix before judging.
What you will learn
- Quote benchmarks only with their definition: percentile, bounce definition and conversion event must match yours
- Re-weight a blended benchmark to your own new-versus-returning mix; in the example an 8.3% gap shrank to 1.8%
- Check the 95% interval before acting: 428 conversions in 20,000 sessions gives about 1.95% to 2.35%
Which website benchmarks are worth using?
Most "website benchmark" pages quote one blended number (an average bounce rate, an average conversion rate) with no definition behind it. A benchmark is only useful when you can say who was measured, over what period, with which definition, and at which percentile. Three public sources meet that bar and cover the three things people usually want to compare:
- Speed and page weight: the HTTP Archive's Web Almanac 2024, built from real-user Chrome data and a monthly crawl of websites.
- Experience thresholds: Google's Core Web Vitals guidance on web.dev, which fixes the "good" line for each metric and says to judge it at the 75th percentile of page loads.
- Traffic mix and conversion: the Contentsquare 2026 Digital Experience Benchmarks, a vendor report covering 99 billion web and app sessions on 6,000+ sites (published March 9, 2026). It is vendor-reported and unaudited, so treat it as a reference point, not a target.
Bounce rate gets no row of its own below, because the number depends entirely on how your analytics tool defines a bounce. The ranges and the definition problem are covered in what is a good bounce rate; here the focus is how to compare yourself fairly.
The benchmark table
Each row says where the number comes from. All figures are the sources' own, quoted as published.
| Area | Metric | Public figure | Source |
|---|---|---|---|
| Speed | Sites passing all three Core Web Vitals (with INP) | Mobile 43%, desktop 54% | Web Almanac 2024 |
| Speed | Sites with "good" LCP (mobile) | 59% | Web Almanac 2024 |
| Speed | Sites with "good" INP (mobile) | 74% | Web Almanac 2024 |
| Speed | Sites with "good" CLS (mobile) | 79% | Web Almanac 2024 |
| Speed | Mobile sites with good TTFB (under 800 ms) | 42% | Web Almanac 2024 |
| Weight | Median page weight | Mobile 2,311 KB, desktop 2,652 KB | Web Almanac 2024 |
| Weight | Median requests per home page | Mobile 70, desktop 74 | Web Almanac 2024 |
| Weight | Median JavaScript per page | Mobile 558 KB, desktop 613 KB | Web Almanac 2024 |
| Weight | Median images per page | Mobile 900 KB, desktop 1,054 KB | Web Almanac 2024 |
| Audience | Mobile share of traffic | 69.9% | Contentsquare 2026 |
| Audience | Share of traffic that is return visits | 52.8% | Contentsquare 2026 |
| Conversion | Returning visitors vs new visitors | 2.9% vs 1.7% | Contentsquare 2026 |
| Conversion | Desktop vs mobile | Desktop converts 74% higher than mobile | Contentsquare 2026 |
| Conversion | By channel | Paid search 2.8%, AI-referred 1.3%, organic social 0.7% | Contentsquare 2026 |
Two caveats before using any row. The Web Almanac's own text gives slightly different desktop LCP shares in two places (72% and 74%), which is why the table only lists the mobile split for each metric. And the conversion rows only include sites that record conversion events, so they skew toward retail, travel and similar sites; a lead-generation or content site should expect different levels.
Why your number and the benchmark rarely use the same definition
Three definitions cause most false alarms:
- Percentile. Core Web Vitals are judged at the 75th percentile: a page passes when at least 75% of loads meet the target for LCP (2.5 seconds), INP (200 milliseconds) and CLS (0.1). An average load time can look fine while the p75 fails. Compare p75 to p75.
- Bounce. In Google Analytics 4 a session is engaged if it lasts longer than 10 seconds, has a key event, or has 2 or more page or screen views; bounce rate is the share of sessions that are not engaged. A tool that counts only single-page visits will report a different number for the same traffic.
- Conversion. A "conversion" is whatever your goal says it is. A newsletter signup and a paid order are both conversions, and a benchmark that mixes them is meaningless for you. Use a benchmark only when its conversion event matches yours.
A rule of thumb: if the benchmark does not state the percentile, the bounce definition or the conversion event, do not put it on a slide.
| Metric | Where definitions differ | What to confirm before comparing |
|---|---|---|
| Core Web Vitals pass rate | Average versus 75th percentile of loads | Use p75 for LCP 2.5 s, INP 200 ms and CLS 0.1 |
| Bounce rate | Not engaged (GA4) versus single-page visit | Which definition your tool uses |
| Conversion rate | Any goal versus the same goal type | Same conversion event and same visitor mix |
| Page weight | Mean versus median; mobile versus desktop | Median, same device class |
| Traffic mix | Share of mobile and returning visits | Re-weight the benchmark to your mix |
Source for thresholds and definitions: web.dev Web Vitals and GA4 Help, checked 2026-11-20.
Worked example: compare a site fairly, not by headline average
Sample data: a store had 20,000 sessions last month. 12,000 were new visitors (180 conversions) and 8,000 were returning visitors (248 conversions).
| Segment | Sessions | Conversions | Rate | Benchmark rate |
|---|---|---|---|---|
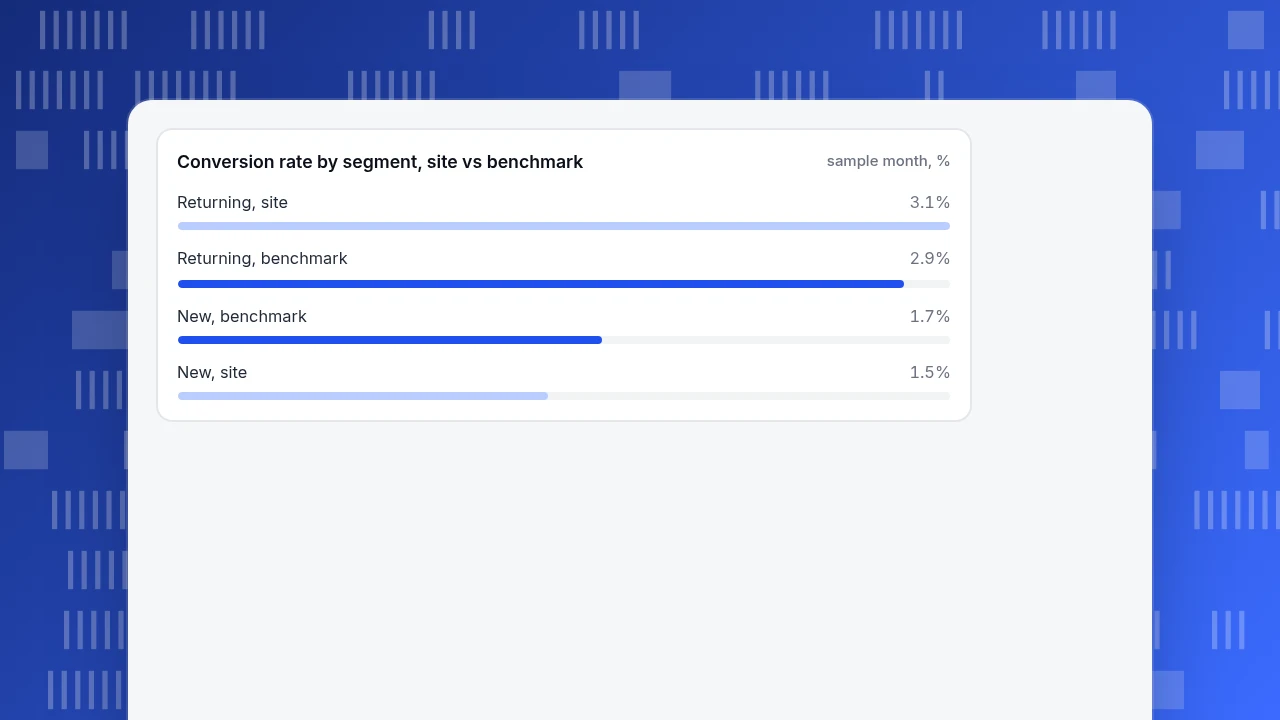
| New | 12,000 | 180 | 1.50% | 1.7% |
| Returning | 8,000 | 248 | 3.10% | 2.9% |
| All | 20,000 | 428 | 2.14% | see below |
Step 1: the naive comparison. The benchmark's blended rate uses its own traffic mix: 52.8% returning and 47.2% new, so 0.528 × 2.9% + 0.472 × 1.7% = 2.33%. The site's 2.14% looks 8.3% below it (2.14 ÷ 2.33 − 1).
Step 2: re-weight the benchmark to your mix. This site is 40% returning and 60% new, so the benchmark at your mix is 0.4 × 2.9% + 0.6 × 1.7% = 2.18%. The gap shrinks to 1.8% (2.14 ÷ 2.18 − 1).
Step 3: check the noise. With 428 conversions in 20,000 sessions, the 95% Wilson interval for 2.14% is about 1.95% to 2.35%. The re-weighted benchmark (2.18%) sits inside it, so there is no evidence this site is behind. By segment, new visitors are 12% below the benchmark (1.5% vs 1.7%), returning visitors 7% above it (3.1% vs 2.9%); the first-visit experience is the place to look, not the checkout.
The lesson: most of the "gap" was a different mix of visitors, not a different quality of site. Always compare within a segment, or re-weight the benchmark to your mix, before you decide anything is broken.
Conversion rate by segment, site vs benchmark
sample month, %How to build your own benchmark in four steps
External numbers answer "are we in the normal range"; your own history answers "are we getting better". Do both:
- Fix the definitions. Write down the conversion event, the session definition and the percentile for each metric, and do not change them mid-year.
- Segment before you compare. At minimum split by device (mobile vs desktop), new vs returning, and the top three channels. A blended number hides which segment moved.
- Compare against the same period. Use the same weekdays and the same season. A week against the previous week is fine for an alarm; for judging, use the same period last year or the last four comparable weeks.
- Set a target band, not a point. Take your last 8 comparable periods, and mark the range between the lowest and highest. Anything outside it is worth investigating; anything inside it is noise.
For speed, add one check against the table above: if your median mobile page is far heavier than 2,311 KB or makes far more than 70 requests, weight is a likely cause; good page load time covers what to do about it.
When a benchmark misleads
- Survivorship and mix. Benchmark panels come from sites that run a particular tool or are in a particular crawl. They are not a random sample of the web.
- Bots in the denominator. If your analytics counts crawlers as visitors, your conversion rate is understated and your bounce rate overstated, and no benchmark will match. Check that your report excludes bots before you compare.
- Seasonality. The Contentsquare comparison is Q4 against Q4; a December store compared with a benchmark that includes July is not like for like.
- Averages from skewed data. Page weight and load time are heavy-tailed. Use medians and percentiles, as the Web Almanac does.
Compare yourself with your own data in TapCub
Take the example above and run it on a real site. TapCub does not publish benchmarks of its own; it gives you the segments to compare yourself fairly.

- Check the denominator first. New projects count recognised bots and AI crawlers only in Web analytics › Bots, not in human visitors, so your conversion rate is not diluted. If someone changed the setting to Do not detect, switch it back before comparing.
- Read the speed line at p75. Open Monitoring › Performance. The cards use the same thresholds as web.dev (LCP 2.5 s, INP 200 ms, CLS 0.1) and can be switched to P75; check the share rated good, then break down by page, device and country to find the slow paths.
- Get conversions by segment. Define the goal under Web analytics › Goals, then open Web analytics › Sources and click a row (for example one channel) to add it as a filter; the date comparison in the header can be set to the previous period or the same period last week.
- Compare like with like. Use the header comparison for the same-weekday check from step 3 of the previous section, and keep the range at 30 days or longer so the segment counts are large enough to compare.
TapCub reports your numbers; it does not tell you whether a number is "good" against an industry panel. Use the public table above for that, and apply the re-weighting step before drawing a conclusion.
FAQ
What is a good website conversion rate?
There is no single figure. In Contentsquare's 2026 report, returning visitors converted at 2.9% and new visitors at 1.7%, paid search at 2.8% and organic social at 0.7%. The right comparison is the same segment, the same conversion event and the same season. Compare within a segment rather than against one blended average.
What percentage of websites pass Core Web Vitals?
In the Web Almanac 2024, 43% of websites passed all three Core Web Vitals on mobile and 54% on desktop. Passing means meeting the targets at the 75th percentile: LCP of 2.5 seconds or less, INP of 200 milliseconds or less and CLS of 0.1 or less.
How big should a web page be?
The median page in the Web Almanac 2024 was 2,311 KB on mobile and 2,652 KB on desktop, with about 70 to 74 requests. That is a description of what exists, not a target. Aim for pages that meet your Core Web Vitals; weight matters mainly because of how it affects LCP.
Can I compare my bounce rate with a benchmark?
Only if both use the same definition. GA4 counts a session as a bounce when it is not engaged (10 seconds or less, no key event, fewer than two views). A tool that counts single-page sessions will give a different figure for the same traffic, so check the definition first.
How often should I update my benchmarks?
Update external benchmarks when a new edition is published, usually once a year, and check the dataset period. Refresh your own target band every month or quarter, using the last eight comparable periods.
Sources
- HTTP Archive, Web Almanac 2024: Performance and Page Weight, checked 2026-11-20.
- Google, Web Vitals, checked 2026-11-20.
- Contentsquare, 2026 Digital Experience Benchmarks: conversions, published 2026-03-09, checked 2026-11-20.
- Google Analytics Help, Engagement rate and bounce rate, checked 2026-11-20.
Was this article helpful?
We use your answers to fix and expand this page.
Couldn’t send. Please try again in a minute.
Thanks for the feedback. We’ll use it to improve this page.You’ve already sent feedback on this page. Thanks.

Data Engineer
Writes about event design, data quality, and collection workflows, with verifiable implementation methods for reliable analytics.