Try it on your own data
Every report in this article is in the free plan. One snippet for web and apps, up to 10 sites.
Start freeBusiness intelligence (BI) answers "what happened?" with governed, repeatable reports; data analytics answers "why?" and "what next?" by exploring detailed data. A small team with one product usually gets more from analytics first, with named events and one identity per person, than from BI on unreliable data. Below: a comparison, five questions, a worked example and the smallest useful setup.
What you will learn
- Use BI to notice that a number moved and analytics to explain why; a dashboard alone rarely answers the second question
- Start with analytics when you have one product and few sources; add BI when three or more sources must be joined or audited numbers are required
- Write metric definitions before buying any tool: no BI product fixes two departments defining 'active user' differently
What each term means, and why they blur
The phrase "business intelligence" is older than most analytics tools. In 1958 Hans Peter Luhn of IBM described a "business intelligence system" as an automatic way to disseminate information to the parts of an organisation that need it, matched to their interests. Today Gartner defines business intelligence (BI) as an umbrella term for the applications, infrastructure, tools and best practices that give access to and analysis of information to improve and optimise decisions and performance.
Business intelligence in practice means: take data from known sources (finance, CRM, orders), model it once into agreed definitions of revenue, customer or margin, and publish it as dashboards and scheduled reports that many people read the same way. Data analytics in practice means: take detailed data, often event-level, and explore it to find out why something changed or what is likely to happen next, using breakdowns, funnels, cohorts, statistics or models.
The two overlap. Analytics work feeds BI dashboards; BI dashboards raise the questions that analytics answers. Vendors use the terms interchangeably, so do not expect product pages to settle it. This article uses a working split that is useful for choosing tools:
- BI answers "what happened, and how are we doing against the plan?" It is repeatable, governed and broad.
- Data analytics answers "why did it happen, and what should we do next?" It is exploratory, detailed and question-driven.
The thesis of the article: a team of a few people with one product usually gets more from analytics first, which means named events and a consistent identity for the same person, than from a BI product on top of data that is not yet reliable. BI earns its place when many sources must be joined and many people must trust the same numbers.
BI versus data analytics: the comparison
The table below sets the two side by side on eight dimensions that matter for a decision. The split is a working generalisation, not a rule; real tools mix both.
| Dimension | Business intelligence | Data analytics |
|---|---|---|
| Main question | What happened, and how are we against plan? | Why did it happen, and what next? |
| Typical data | Modelled data from finance, CRM, orders, often in a warehouse | Detailed event-level data, often straight from product tracking |
| Main readers | Many people, including managers and finance | Analysts, product and marketing people exploring |
| Output | Dashboards and scheduled reports | Breakdowns, funnels, cohorts, models, findings |
| Freshness | Often daily or hourly, tuned to reporting | Minutes to hours when reacting to changes |
| Definitions | Governed once, shared by everyone | Defined per question, risk of drift |
| Setup effort | Higher: sources, modelling, permissions | Lower to start: tracking and identity |
| Typical failure | Official-looking numbers on unreliable data | Exploration without agreed definitions |
A working generalisation, not a rule: real tools mix both.
Five questions that decide which to start with
Answer these in order. Each ends in an if-then rule.
- Which decision repeats every week? If the answer is "the same five numbers for the same audience", you need a report that refreshes itself, which is the BI pattern. If the answer is "something moved and nobody knows why", you need exploration, which is analytics.
- How many systems must be joined? One product database or one analytics tool: you probably do not need BI yet. Three or more sources joined on shared customer or order keys (billing, CRM, support, product): that is where a warehouse and BI earn their keep.
- Who reads the output, and how technical are they? A founder or marketer who wants to click through a funnel: analytics tool. A finance team or board that wants the same layout every month: BI.
- How fresh must it be? Reacting to a campaign launch within minutes needs near-real-time event data. A monthly close needs correct numbers, not fast ones.
- Who owns the definition of each metric? If "active user" or "customer" means different things in three departments, no tool will fix it. Write the definitions before buying anything, in a data dictionary or tracking plan.
If you answered "analytics" to question 1 and "no" to question 2, begin with analytics and revisit in six months. The strategy-level view of this choice is in data strategy, and how the kinds of analysis differ is in types of data analytics.
Worked example: one number, two questions
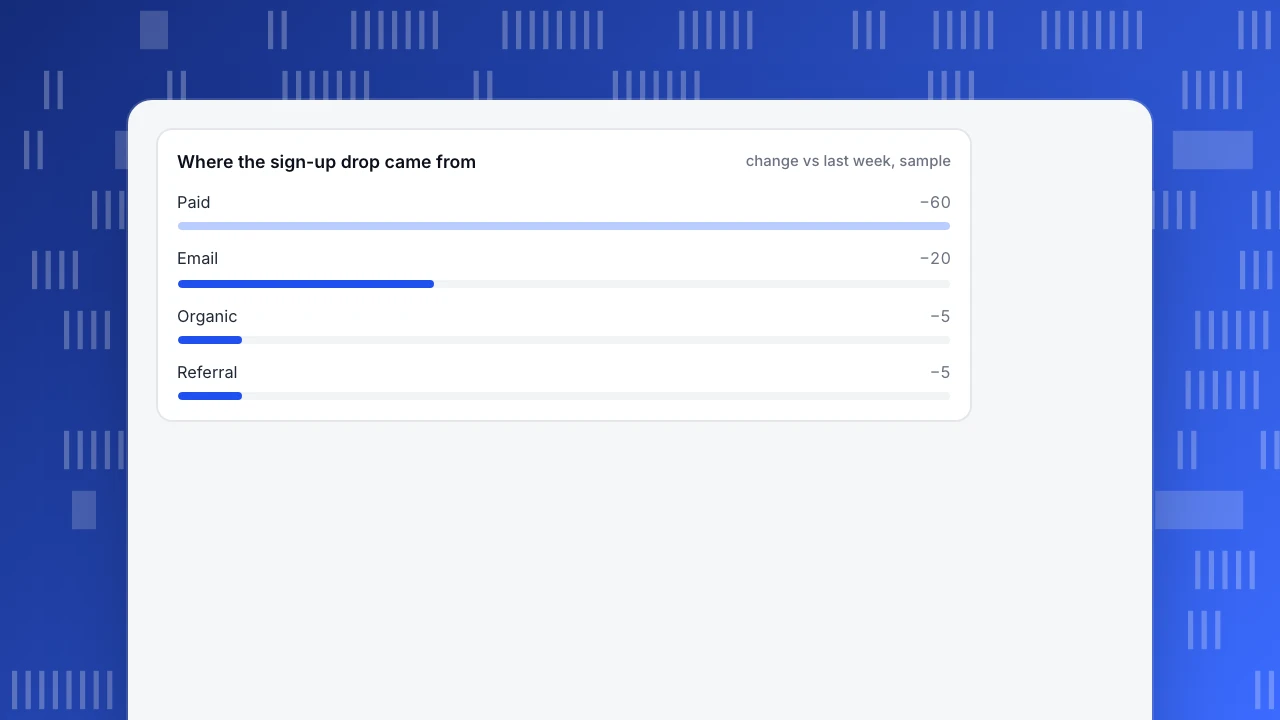
Sample data: a product gets 500 sign-ups one week and 410 the next. A BI dashboard reports it correctly: 410 sign-ups, down 90, or −18.0%. That is the "what happened" half. It tells you to worry but not where to look.
Analytics starts by splitting the change by channel:
| Channel | Last week | This week | Change | Change in % | Share of the total drop |
|---|---|---|---|---|---|
| Organic | 220 | 215 | −5 | −2.3% | 5.6% |
| Paid | 150 | 90 | −60 | −40.0% | 66.7% |
| Referral | 80 | 75 | −5 | −6.3% | 5.6% |
| 50 | 30 | −20 | −40.0% | 22.2% | |
| Total | 500 | 410 | −90 | −18.0% | 100% (rounded) |
The "share of the total drop" column is each channel's change divided by the total change of −90. Paid explains two thirds. Email fell by the same percentage as paid but from a smaller base, so it explains a fifth. Organic and referral are noise.
Next question: did paid get worse at converting, or did it get less traffic? Sample figures:
| Paid channel | Sessions | Sign-up rate | Sign-ups |
|---|---|---|---|
| Last week | 2,500 | 6.0% | 150 |
| This week | 1,500 | 6.0% | 90 |
Sessions fell 40.0% while the sign-up rate did not move, so the problem is volume, not quality: the next thing to check is spend, budget caps or a paused campaign, not the landing page. That is the "why" half, and it needed a drill-down the dashboard was not built to show. A good BI setup might include the channel breakdown too; the point is that the second question, the sign-up rate within paid, was not planned in advance, which is the typical difference between a report and an exploration.
The decision rule from this example: use BI to notice, use analytics to explain. If every "why" requires a request to someone who builds a new report, the team is using the wrong tool for the second half.
Where the sign-up drop came from
change vs last week, sampleWhich to start with: a decision table
| Your situation | Start with | Add later |
|---|---|---|
| One website or app, 1–5 people, events in an analytics tool | Analytics | A small BI layer when finance asks for monthly packs |
| Product, billing and CRM all hold parts of the customer, and the board wants audited numbers | A warehouse and BI | Analytics for product questions |
| Enterprise data analytics with many teams and many sources | Both, with a shared metric layer | Governance, catalogue and lineage |
| Metrics disputed between teams | A written metric dictionary first | Whichever tool displays it |
| Need to react to campaign changes the same day | Analytics with near-real-time events | Alerts |
For the bigger tool landscape, see data analytics platforms. The same question seen from the product manager's chair is in analytics for product managers.
The smallest useful setup for a small team
If you start with analytics, four things make it work. None needs a data engineer.
- Named events with a tracking plan. Ten to twenty events that map to the steps of your product, each with a defined name and properties. Naming consistency matters more than volume.
- One identity per person. Anonymous visits should be connected to the account after login, so a visitor and the later customer are the same record.
- Five saved reports. A funnel, a retention view, a channel breakdown, a weekly active measure and one revenue or goal measure. Review them in a fixed meeting.
- An export path. When finance or a board wants the numbers elsewhere, export them rather than rebuild them.
Add BI when one of these triggers appears: three or more sources need to be joined; two departments dispute a metric and need one governed definition; someone must see only their own region's rows; or audited numbers are required. A chart tool is not BI by itself; see data visualization for what charts add on top of data.
Common mistakes
- Buying BI to fix unreliable data. A dashboard on top of duplicate events and inconsistent names makes the wrong numbers look official.
- Treating dashboards as analysis. A dashboard tells you that something moved. It rarely tells you why.
- Building analytics without definitions. Fast exploration on metrics nobody has defined produces arguments, not decisions.
- Counting people differently in each tool. A BI count of "customers" and an analytics count of "users" will differ for legitimate reasons. Label which is which.
- Waiting for a warehouse before starting. Many first questions can be answered from event data alone.
- Judging tools by the number of charts. The useful measure is how long it takes to go from "that moved" to "this is why".
How TapCub fits: analytics for the second question
TapCub is website, app and product analytics. It is not a BI suite and not a data warehouse. Here is the sign-up drop from the example worked through in it, and where its edges are.
- Notice the drop. Look at sign-ups on All-platform analytics › Behavior › Behavior analysis or a goal on Web analytics › Goals. Real humans and bots are counted separately, so the denominator is not inflated by crawlers.
- Split the change. Open All-platform analytics › Operations › AI Assistant and use the Change attribution tab: pick a metric, compare it with the previous period or the same period last year, and split it by channel, source domain, country, device, landing page or platform, one or two levels deep. The contribution of each value is its change divided by the total change, the same calculation as the table above. The assistant's numbers come from analytics queries on your project, and you open or save the analysis yourself.
- Check the cost side. If paid fell, import spend by day and channel on All-platform analytics › Business › Channel ROI and read cost per click (spend ÷ sessions) and return on ad spend per channel, source or campaign. TapCub measures; it does not place or optimise ads.
- Define the metric yourself. On All-platform analytics › Behavior › Metrics & SQL, define a custom metric from an event and an aggregation, or query event data in SQL.
- Hand off when BI is the right place. Raw detail can be requested through an asynchronous export on All-platform analytics › Data › Data export, and a read-only public share link can show selected modules with an optional password. TapCub does not model cross-system data or serve as an audited finance layer; if you need that, the export is the starting point for your BI or warehouse.
FAQ
Is business intelligence part of data analytics?
Usage varies. Some sources treat analytics as one technique within BI, others treat BI as the descriptive part of analytics. A practical split: BI reports on what happened with agreed definitions, analytics explores why and what next. Treat the boundary as blurry and choose by the question.
What is a BI product?
A BI product is software for connecting to business data, modelling shared definitions such as revenue or customer, and publishing dashboards and scheduled reports to many readers. It usually sits on top of a database or warehouse. For how tools compare, see data analytics platforms.
Do I need BI if I already have an analytics tool?
Not necessarily. If one tool holds your product events and one team reads them, BI adds cost before it adds insight. Add it when you must join several systems, govern metric definitions across teams, or give audited numbers to finance or a board.
What is enterprise data analytics?
It is data analytics at organisation scale: many sources, many teams, governance, shared metric definitions and often a warehouse, with BI for broad reporting and analytics for exploration. The challenge is less the tooling than agreeing definitions and ownership across departments.
Which should a small team set up first?
Analytics first: a tracking plan with named events, one identity per person, a handful of saved reports and a weekly review. Add BI when three or more sources need joining or audited numbers are required.
See also: Business Analytics Software: How to Choose With 4 Criteria and a Scorecard.
See also: Open Source BI: The Hidden Costs of Sources, Permissions and Operations.
Sources
Was this article helpful?
We use your answers to fix and expand this page.
Couldn’t send. Please try again in a minute.
Thanks for the feedback. We’ll use it to improve this page.You’ve already sent feedback on this page. Thanks.

Customer Experience Consultant
Writes about live chat, visitor conversations, and self-service, sharing practical ways to make customer communication clearer and more effective.