Try it on your own data
Every report in this article is in the free plan. One snippet for web and apps, up to 10 sites.
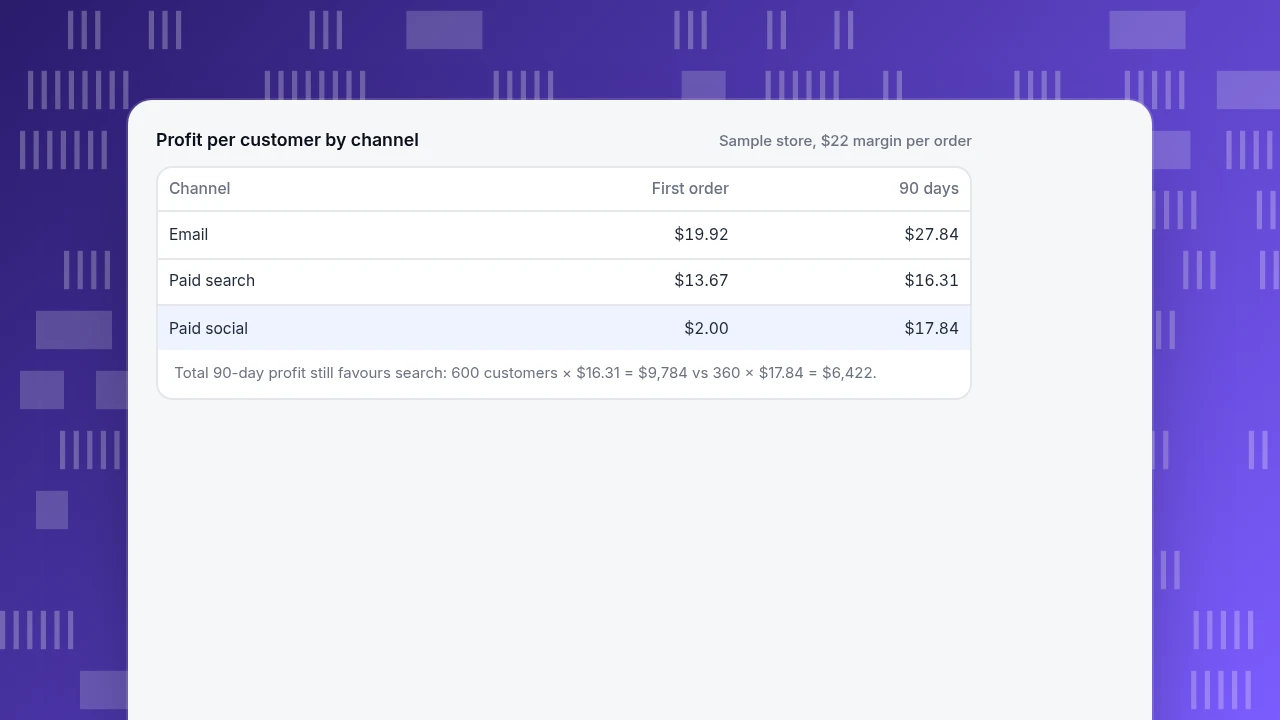
Start freeB2C marketing is getting individual consumers to buy for themselves, through short decisions and many small orders. Because of that, the work comes down to two numbers per channel: what a customer costs and how often they buy again. In the sample below, paid social has the weakest first-order profit ($2.00 per customer) yet beats paid search over 90 days ($17.84 against $16.31) once repeat purchases are counted.
What you will learn
- B2C decisions are short and volumes are high, so cost per customer and repeat rate decide which channel earns its budget
- Rank channels on value per customer over a fixed window; first-order profit alone misleads
- Set the reporting window from your own data: choose the one that captures about 95% of orders
What is B2C marketing, and how is it different from B2B?
B2C (business-to-consumer) marketing is the work of getting individual people to buy for themselves or their households. The buyer is usually also the user, the decision is often made alone, and the purchase can happen in minutes. B2B marketing sells to organisations, where several people take part in a decision that can run for months. The consumer side is large: the US Census Bureau estimated second-quarter 2026 retail e-commerce sales at $329.5 billion (not adjusted), 16.4% of total US retail sales.
| B2C | B2B | |
|---|---|---|
| Who decides | One person, sometimes a household | A buying group: user, approver, budget holder |
| Decision time | Minutes to days | Weeks to months |
| Typical order value | Low to mid, often tens of dollars | Higher, often thousands per year |
| Number of buyers | Many; volume does the work | Few; each account matters |
| What persuades | Price, convenience, trust, how it feels | Fit, risk, return on investment, references |
| Where the money is made | Many small orders plus repeat purchases | Few large deals plus renewals |
| What you measure first | Conversion rate, cost per customer, repeat rate | Pipeline, win rate, sales cycle |
The row that matters most for how you work is the second-to-last one: a B2C business earns its profit on the second and third order at least as much as on the first. That is why this guide ends up caring about two things, channel efficiency and repeat purchase. For the opposite case, a longer sales process measured by pipeline, see SaaS marketing and B2B website metrics.
Why do short decisions and high volume change what you measure?
Short decisions and high volume have three consequences you can act on.
- Small differences add up. A channel that converts at 2.4% instead of 1.2% on 25,000 sessions produces 600 orders instead of 300. With many sessions, even a half-point change is visible within days, which makes testing fast and also makes noise easy to mistake for signal.
- The measurement window is short. If most buyers decide in the same session or within a few days, you can read campaign results within a week. The tradeoff is that a thin slice of slower buyers is credited to the wrong channel or to none.
- Margin per order is thin, so acquisition cost decides everything. A $55 order at 40% gross margin leaves $22. Spending $20 to get that customer leaves $2 on the first order. The business only works if that customer comes back.
Put together: B2C marketing is mostly a question of what each customer costs and how many times they buy, answered per channel. The next section does the arithmetic on sample data.
Worked example: ranking three channels two ways
Sample data: a store sells at an average order value of $55 with a 40% gross margin, so each order contributes $55 × 0.40 = $22. For simplicity, treat every order from a channel as a new customer.
| Channel | Spend | Sessions | Conversion | Orders | Cost per customer | 90-day repeat |
|---|---|---|---|---|---|---|
| $500 | 8,000 | 3.0% | 240 | $2.08 | 30% of buyers, 1.2 repeat orders each | |
| Paid search | $5,000 | 25,000 | 2.4% | 600 | $8.33 | 12% of buyers, 1.0 repeat order each |
| Paid social | $7,200 | 30,000 | 1.2% | 360 | $20.00 | 45% of buyers, 1.6 repeat orders each |
Orders = sessions × conversion rate (for search, 25,000 × 0.024 = 600). Cost per customer = spend ÷ orders (for search, $5,000 ÷ 600 = $8.33).
View 1: first-order profit per customer = $22 − cost per customer.
- Email: $22 − $2.08 = $19.92
- Paid search: $22 − $8.33 = $13.67
- Paid social: $22 − $20.00 = $2.00
On the first order, social looks weak and email looks excellent.
View 2: 90-day profit per customer = first-order profit + repeat orders per buyer × $22.
- Email: repeat orders per buyer = 0.30 × 1.2 = 0.36, worth $7.92, so $19.92 + $7.92 = $27.84
- Paid search: 0.12 × 1.0 = 0.12 orders, worth $2.64, so $13.67 + $2.64 = $16.31
- Paid social: 0.45 × 1.6 = 0.72 orders, worth $15.84, so $2.00 + $15.84 = $17.84
Now social overtakes search per customer: $17.84 against $16.31. The ranking of the middle and bottom channel flipped once repeat purchases were counted.
Two cautions in this example. First, total profit still favours search, because it brought 600 customers: 600 × $16.31 = $9,784, against 360 × $17.84 = $6,422 for social. Per-customer value tells you whether a channel is worth funding; volume and the room to scale decide how much. Second, email is mostly an owned channel: its low cost per customer reflects selling to people who already subscribed, so it cannot absorb a larger budget the way paid channels can.
Profit per customer by channel
Sample store, $22 margin per order| Channel | First order | 90 days |
|---|---|---|
| $19.92 | $27.84 | |
| Paid search | $13.67 | $16.31 |
| Paid social | $2.00 | $17.84 |
Total 90-day profit still favours search: 600 customers × $16.31 = $9,784 vs 360 × $17.84 = $6,422.
What metrics matter for B2C marketing?
A short list covers most decisions. All of them can be computed per channel.
| Metric | Formula | Sample value | Question it answers |
|---|---|---|---|
| Conversion rate | Orders ÷ sessions | 600 ÷ 25,000 = 2.4% | Does the traffic buy? |
| Cost per click | Spend ÷ sessions | $5,000 ÷ 25,000 = $0.20 | What does a visit cost? |
| Cost per customer (see CAC) | Spend ÷ new customers | $5,000 ÷ 600 = $8.33 | What does a customer cost? |
| Average order value | Revenue ÷ orders | $55 | How much does an order bring? |
| Repeat rate (see repeat rate) | Buyers with 2 or more orders ÷ buyers | 12% in 90 days | Do they come back? |
| Lifetime value (see LTV) | Margin per order × orders per customer, over a chosen window | $16.31 in 90 days | What is a customer worth? |
Pair every cost metric with a value metric. Cost per customer alone favours the cheapest channel; lifetime value alone ignores what you paid. The wider set of marketing numbers, and which ones to retire, is in marketing KPIs, and the ecommerce version is in ecommerce KPIs.
Which channels fit B2C, and what does each need?
Each channel has one job and one number that tells you whether it is doing it.
| Channel | Best at | Number to watch | Watch out for |
|---|---|---|---|
| Search (organic and paid) | Catching people who already want the product | Conversion rate; cost per customer | Demand is limited by how many people search |
| Social and influencers | Creating demand and awareness | 90-day value per customer, not first-order profit | Looks poor on last-click; needs a longer window |
| Email and SMS | Bringing existing customers back | Repeat rate; revenue per send | List fatigue; only reaches people you already have |
| Affiliates and marketplaces | Reaching shoppers on someone else's audience | Margin after fees and returns | Fees can remove most of the $22 margin |
| Referrals and loyalty | Making repeat purchases cheaper | Share of orders from existing customers | Rewards that discount orders that would have happened anyway |
| Content and SEO | Compounding free traffic | Orders and assisted orders per article | Slow to start; hard to credit under last-click |
Which channel gets credit for an order depends on the attribution rule you choose. Social and content usually look weaker under last-click and stronger under multi-touch rules; see multi-touch attribution for how to compare them.
| Channel | Best at | Number to watch |
|---|---|---|
| Search | Catching existing demand | Cost per customer |
| Social and influencers | Creating demand | 90-day value per customer |
| Email and SMS | Bringing customers back | Repeat rate |
| Content and SEO | Compounding free traffic | Orders and assisted orders |
Judge awareness channels on a longer window than last-click.
How long does a B2C buyer take to decide?
Measure it instead of guessing, because it sets how long your reporting window should be. Sample data: for 1,000 orders in a month, the time from first visit to purchase was split like this.
| Time from first visit to order | Orders | Cumulative share |
|---|---|---|
| Same session | 700 | 70% |
| Days 1 to 3 | 200 | 90% |
| Days 4 to 7 | 60 | 96% |
| Days 8 to 14 | 30 | 99% |
| Days 15 to 30 | 10 | 100% |
A 7-day attribution window captures 96% of orders in this sample and leaves 4% unassigned; a 14-day window captures 99%. Long windows add little for low-priced goods, but they matter for bigger purchases such as furniture or electronics, where people compare for weeks. The rule: choose the window that captures about 95% of your own orders, and widen it for products that take longer. The journey itself is the subject of the purchase path.
How do you segment B2C customers for repeat purchases?
The cheapest order to win is a repeat order, so the main segmentation is by recency and frequency. A simple three-step version:
- New buyers (first order in the last 30 days): send help with first use or a relevant follow-up; the goal is the second order.
- Active repeat buyers: do not discount them by default; they already come back.
- Lapsed buyers (no order in a period longer than their typical gap): offer a reason to return, then stop if there is no response.
A finer version scores every customer by recency, frequency and monetary value, which is what RFM does. The gap in step 3 should come from your data: if buyers usually reorder every 40 days, someone silent for 120 days is lapsed, while someone silent for 25 days is not.
Common mistakes in B2C marketing
- Judging social on last-click. In the example, social had the lowest first-order profit and the second-highest 90-day value. Judge awareness channels on a longer window.
- Optimising conversion rate alone. Email converts at 3.0% but cannot take more budget; the best conversion rate says nothing about how much you can spend.
- Using revenue where margin belongs. Return on ad spend based on $55 revenue looks better than what the business keeps from $22 of margin. Count returns and discounts too.
- Ignoring returns. In some regions, buyers get a legal cooling-off period for distance purchases, 14 days in the EU for example, so the first order is not final until the period passes.
- Treating every visit as a person. Bots and crawlers inflate sessions and deflate conversion rate. Exclude them before computing anything.
- Buying without a repeat plan. A customer who costs $20 and never returns loses money on a $22 margin once fulfilment is counted.
- Copying a B2B funnel. A B2C visitor may go from ad to order in one session; a six-stage nurture flow adds friction.
How to measure B2C marketing in TapCub
Take the store from the example. Spend is in your ad accounts and an email platform; TapCub does not run ads or send email, and it does not do campaign bidding. It measures what happened on your site and app.
- Keep the traffic clean. Open Web analytics › Bots. Recognised bots and AI crawlers are counted separately from people, so sessions in the conversion-rate denominator are people.
- Bring in spend. Under All-platform analytics › Business › Channel ROI, import spend by day, channel, source or campaign (CSV or one entry at a time). The page shows cost per click (spend ÷ sessions), cost per customer (spend ÷ purchases in orders) and return on ad spend, grouped by channel, source or campaign. That is the first table of the example, built for you.
- Compare attribution rules side by side. In All-platform analytics › Behavior › Behavior analysis, choose first, last, linear, position and time-decay models together. Each gets its own column, and a channel that mostly assists, like social in the example, shows up as such. The default lookback is 30 days, adjustable from 1 to 90, which lets you set the window you measured above.
- Find the repeat buyers. Build a segment of people who purchased in All-platform analytics › Users › Segments & tags; RFM gives 10 groups and records movement between them. Take the segment into retention in Behavior analysis to see how many come back by period. Segments need identified users, so call
tapcub.loginwhen people sign in; anonymous visitors do not have profiles. - Decide. Fund by 90-day value per customer, not first-order profit; the total profit and the room to scale are yours to check.
TapCub does not calculate margin from your costs; the $22 contribution is a number you bring from your own books.
FAQ
What is B2C marketing?
B2C marketing is the set of activities that persuade individual consumers to buy for themselves, usually through short decisions and many small orders. It differs from B2B in who decides, how long it takes and what you measure first: conversion rate, cost per customer and repeat rate rather than pipeline and win rate.
What is the difference between B2B and B2C marketing?
B2C sells to one person, in minutes to days, at lower order values, through volume and repeat purchase. B2B sells to a buying group, over weeks or months, at higher order values, through fewer accounts and renewals. B2C leans on price, convenience and trust; B2B on fit, risk and return.
What is a good B2C marketing strategy?
Start from unit economics: contribution per order, cost per customer by channel, and repeat rate. Fund channels whose value per customer over a fixed window, such as 90 days, exceeds their cost, keep a repeat-purchase programme for existing buyers, and review the measurement window against how long your own buyers take to decide.
Which B2C marketing channels work best?
It depends on the product and the margin. Search captures existing demand, social and content create it, email and loyalty programmes bring buyers back, and marketplaces reach someone else's audience for a fee. Compare channels on cost per customer and 90-day value, not on last-click conversion alone.
How do you measure the success of B2C marketing?
Per channel, track conversion rate, cost per customer, average order value, repeat rate and lifetime value over a fixed window. Always pair a cost measure with a value measure, use margin rather than revenue, and exclude bots from sessions so the conversion rate reflects people.
Sources
- US Census Bureau. Quarterly Retail E-Commerce Sales Report — second-quarter 2026 retail e-commerce estimate of $329.5 billion not adjusted, 16.4% of total retail sales. Checked 2026-11-19.
- European Union. Directive 2011/83/EU on consumer rights — Article 9: 14-day right of withdrawal for distance contracts. Checked 2026-11-19.
Was this article helpful?
We use your answers to fix and expand this page.
Couldn’t send. Please try again in a minute.
Thanks for the feedback. We’ll use it to improve this page.You’ve already sent feedback on this page. Thanks.

Product Experience Specialist
Explores usability, user journeys, and feature adoption through practical examples of onboarding and everyday product use.