Try it on your own data
Every report in this article is in the free plan. One snippet for web and apps, up to 10 sites.
Start freeThe B2B sales cycle is the time from a company's first meaningful contact to a signed deal, and it is only useful when split into stages. Report the median, include open deals and find the stage where deals wait longest. Below: a ten-deal mean versus median example, a stage-by-stage breakdown, a sales-velocity calculation and the part your website can see.
What you will learn
- Split the cycle into stages with dated entry events and find where deals wait longest
- Use the median and include open deals; a closed-won mean hides the ones at risk
- The buyer's journey starts before the CRM does: measure first visit to demo request too
What is the B2B sales cycle, and how long is it?
The B2B sales cycle is the time from a company's first meaningful contact with you to a signed deal. No universal number exists: it depends on deal size, how many people must agree and whether security or procurement review is involved. Published ranges run from weeks to more than a year, which is another way of saying your own data is the only useful figure.
Two things make the cycle harder to measure than it sounds. First, it starts earlier than your CRM thinks. Gartner's 2025 survey headline was that 61% of B2B buyers prefer a rep-free buying experience, which means much of the research happens before anyone logs a lead. Second, it is not one number: it is a chain of stages, and the useful question is not "how long is our cycle" but which stage is it stuck in?
That is the thesis of this guide: split the cycle into stages and look for the one where deals wait longest. The funnel view of the same journey is covered in SaaS sales funnel, the handoff between marketing and sales in MQL vs SQL and the buyer's side in B2B customer journey. This article is about time.
Why does the average cycle length hide the problem?
Three habits produce a misleading number:
- Averaging only the deals that closed. Deals that are still open, or were lost, are left out. Statisticians call unfinished observations censored: the NIST handbook puts it as "when not all units on test fail we have censored data." Open deals are exactly that, and ignoring them flatters the cycle.
- Using the mean. A few very long deals pull the average up. The median describes the typical deal.
- Quoting one number for every deal. Small and large deals, new and expansion deals have different cycles. Segment before you average.
Sample data: ten closed-won deals took 38, 41, 47, 52, 58, 63, 71, 85, 112 and 164 days. The sum is 731, so the mean is 731 ÷ 10 = 73.1 days. The median is the average of the fifth and sixth values: (58 + 63) ÷ 2 = 60.5 days. The long tail of two deals adds 12.6 days to the average. Now add six deals still open at 20, 35, 48, 70, 95 and 130 days old. Three of them (70, 95 and 130) are already older than the won median, so they are at risk and invisible in a closed-won average.
How do you break the cycle into stages?
A stage is a period that begins with an event you can point to. Use entry events, not opinions:
| Stage | Entry event | Typical reason a deal waits here |
|---|---|---|
| Qualify | A lead is accepted as worth a conversation | Nobody answers; wrong contact |
| Demo | A call or demo is booked | Scheduling, or the right person missing |
| Evaluation | The buyer starts a trial or technical review | Several people must try it and agree |
| Negotiation | A proposal or quote is sent | Pricing and terms |
| Legal and procurement | The buyer's legal, security or finance review starts | Questionnaires, queues, approvals |
| Closed | Signed |
Record the date each deal enters each stage, ideally automatically in your CRM. The time in a stage is the difference between two entry dates. Without those dates you only know the total, and a total cannot tell you what to fix.
| Stage | Entry event | Why deals wait |
|---|---|---|
| Qualify | Lead accepted | Nobody answers; wrong contact |
| Demo | Call or demo booked | Scheduling; key person missing |
| Evaluation | Trial or technical review starts | Several people must agree |
| Negotiation | Proposal or quote sent | Pricing and terms |
| Legal and procurement | Buyer review starts | Questionnaires and approvals |
Define stages by an entry event you can date, not by opinion.
What does a stage-by-stage cycle look like?
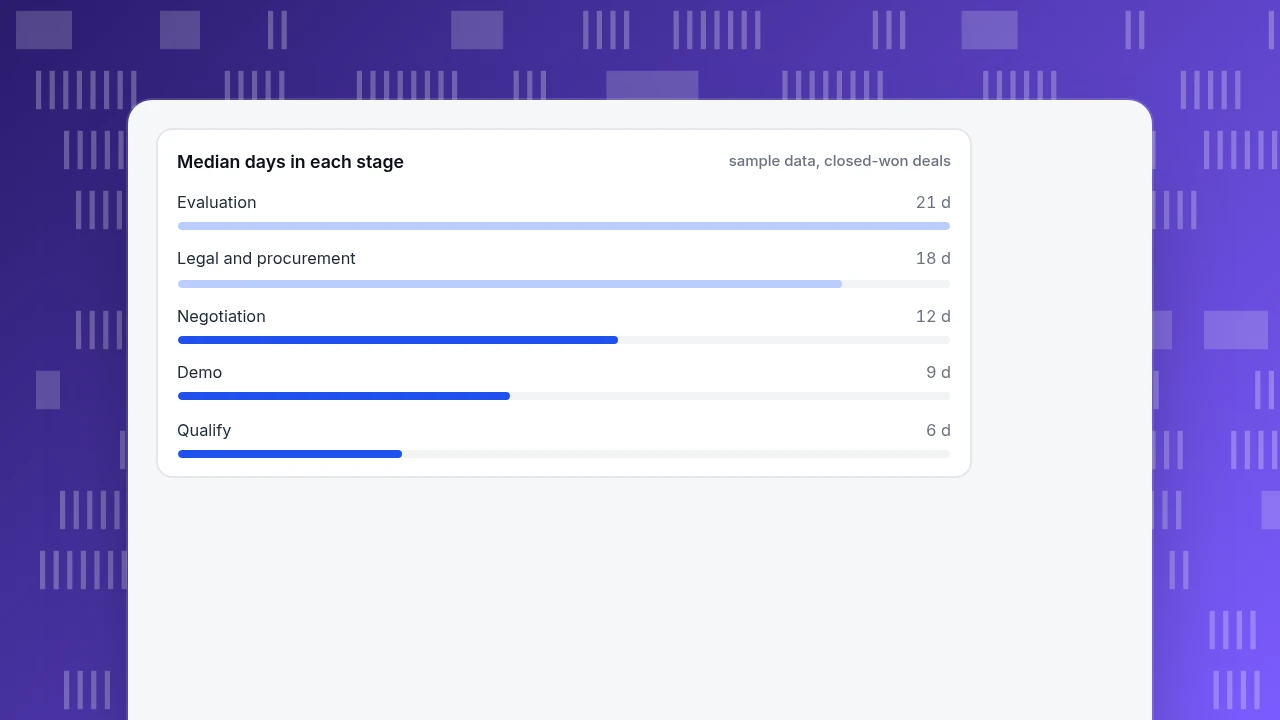
Sample data: median days spent in each stage across closed-won deals.
| Stage | Median days | Share of the cycle |
|---|---|---|
| Qualify | 6 | 9.1% |
| Demo | 9 | 13.6% |
| Evaluation | 21 | 31.8% |
| Negotiation | 12 | 18.2% |
| Legal and procurement | 18 | 27.3% |
| Total | 66 | 100% |
The stage medians add to 66 days. A sum of medians does not equal the median of the totals in general (the whole-deal median above was 60.5), so use it for shares, not as the headline. Evaluation (21) and legal and procurement (18) together take 39 of 66 days, or 59.1%. Those are the stages worth attention; shortening qualification by a day changes almost nothing.
Now try a change. Suppose a one-page pack answering the usual security questions is sent as the evaluation starts, cutting legal and procurement by 6 days, and a shared success plan cuts evaluation by 7 days (one-third). That saves 13 days: the cycle falls from 66 to 53, a 19.7% reduction.
Shorter cycles matter because they raise how fast revenue arrives. A common sales-velocity formula, a convention rather than a standard, is opportunities × average deal value × win rate ÷ cycle length. With 40 opportunities, a $12,000 average deal and a 25% win rate: 40 × 12,000 × 0.25 = 120,000. Divided by 66 days that is $1,818.18 a day; divided by 53 days it is $2,264.15 a day, 24.5% higher, with no extra opportunities and no change in win rate. The numbers are assumptions; the point is that a stalled stage has a price. Recompute the stage medians each quarter and compare the same stage with the quarter before. A shorter total can hide a longer stage that another stage's improvement has masked, and a single large deal can move a median when the sample is only ten deals, so look at the spread as well.
Median days in each stage
sample data, closed-won dealsWhere do the delays usually sit, and what moves them?
| Delay | Typical stage | What may move it |
|---|---|---|
| Only one person on the buyer side is convinced | Evaluation | Help the champion bring in others: a shared summary, a call with their team |
| Security or compliance review | Legal and procurement | Send the documents early, not when asked |
| No agreed deadline | Negotiation | Tie the date to something on the buyer's calendar |
| Unclear next step after a demo | Demo to evaluation | End every call with a dated next step |
| Slow replies on your side | Any | Track time from the buyer's message to your response |
Treat these as hypotheses. The stage durations tell you where to look; the conversations tell you why.
What happens before the cycle starts?
Because buyers research alone first, the clock in your CRM starts late. Your website can see the part before it: when a company first visited, which pages it read and how long it took from the first visit to a demo request.
Sample data: if the median time from first website visit to demo request is 19 days, the buyer's journey is about 19 days longer than the CRM shows. Treated as an approximation (medians do not add exactly), a 60.5-day CRM cycle is closer to 80 days from the buyer's first visit. This does not change the stages above, but it shows where content and a clear demo page can shorten the front of the cycle, and it stops the sales team being judged for time they never controlled.
What do people get wrong about the B2B sales cycle?
- Quoting an industry number. Your deal size and buyer count decide it.
- Averaging closed-won only. Open deals are the ones at risk.
- Using the mean. Report the median and the spread.
- Measuring the total without stage dates. You cannot fix what you cannot locate.
- Counting from the demo request. The buyer started earlier.
- Shortening the wrong stage. Compare each stage's share before choosing a project.
How do you see the front of the cycle in TapCub?
Take the 19-day gap between first visit and demo request. TapCub is not a CRM and does not track deal stages or revenue; those stay in your CRM. What it shows is the website part of the journey:
- In Web analytics › Goals, define the demo request as a goal. In All-platform analytics › Behavior › Behavior analysis, build a funnel from first page view to that goal. Each step shows the median time from the previous step, and the summary shows the median time to complete, which is the web-side equivalent of the 19 days.
- Identify buyers by calling
tapcub.loginwhen someone signs in, for example to a trial. They then appear in All-platform analytics › Users › People, where the profile has a day-by-day timeline of what they read before asking for a demo. - For account-level view, call
tapcub.group('company', 'acme', {...})after login. In All-platform analytics › Users › Accounts you see the number of accounts, active accounts over 30 days, members and a 0–100 health score. Anonymous visitors do not enter accounts, and an account view does not open individual details. - In All-platform analytics › Behavior › Behavior analysis, use attribution to see which channels appear in sessions before a conversion; the look-back window defaults to 30 days and can be set from 1 to 90.
- To connect to deals, export the data (All-platform analytics › Data › Data export) and join it to your CRM. TapCub does not create deals or move stages.
FAQ
How long is the average B2B sales cycle?
There is no reliable universal figure; published ranges run from a few weeks to more than a year depending on deal size and the number of people involved. Measure your own median by segment, using the dates deals enter each stage, and compare it with the stage shares rather than an industry average.
What are the stages of the B2B sales cycle?
A common set is qualify, demo, evaluation, negotiation, and legal and procurement, ending in a signed deal. Define each stage by an entry event you can date, not by a rep's opinion, so you can calculate how long deals stay in each.
How do you calculate the length of a sales cycle?
Subtract the date a deal started from the date it closed, for each closed-won deal, then report the median and the spread, not just the mean. Also track the age of open deals, since they are excluded from a closed-won average and are the ones at risk.
How can you shorten the B2B sales cycle?
Find the stage with the largest share of days and address its cause: bring in the other buyers during evaluation, send security documents early and end every call with a dated next step. Work on the longest stages, since shaving a day from a short one changes little.
What is the difference between the sales cycle and the buying journey?
The sales cycle is what your CRM records, from a logged lead to a signed deal. The buying journey starts earlier, with research the buyer does alone, and continues after. Your website sees part of the earlier period, so the buyer's journey is longer than the cycle.
See also: What is pipeline velocity? Formula and a four-variable example.
Sources
- Gartner. Gartner Sales Survey Finds 61% of B2B Buyers Prefer a Rep-Free Buying Experience, press release, 25 June 2025. Headline checked 2026-11-19; the site blocks automated reads, so only the title was verified.
- NIST/SEMATECH. e-Handbook of Statistical Methods, Censoring: censored data when not all units fail. Verified 2026-11-19.
Was this article helpful?
We use your answers to fix and expand this page.
Couldn’t send. Please try again in a minute.
Thanks for the feedback. We’ll use it to improve this page.You’ve already sent feedback on this page. Thanks.

Product Experience Specialist
Explores usability, user journeys, and feature adoption through practical examples of onboarding and everyday product use.