Try it on your own data
Every report in this article is in the free plan. One snippet for web and apps, up to 10 sites.
Start freeA B2B loyalty program rewards business customers for renewing, expanding and recommending you. It works through renewal and expansion, not points: the buyer spends company money, so value delivered and access matter more than a personal reward. Below: seven program types, the metrics that show whether it works, a design checklist, a worked example where the same program looks like a 71.4% gain or a 42.9% loss, and how TapCub shows account retention.
What you will learn
- Judge a program by gross and net revenue retention at account level, not by points issued or redeemed
- Compare members with similar non-members; the naive comparison in the example was three times too generous (15 points vs 5)
- Prefer rewards that deliver business value (access, training, support) and check the buyer's gift rules before designing any personal reward
What is a B2B loyalty program?
A B2B loyalty program is a structured way to reward business customers for staying, buying more and helping you win others. The difference from a consumer program is who decides. A shopper spends their own money and enjoys a discount or a free item. A business buyer spends the company's money, often through a committee and a contract, and answers to a budget owner. So loyalty in B2B is mostly demonstrated by three behaviours: renewing, expanding and recommending.
That is the claim behind this guide: a B2B loyalty program works through renewal and expansion, not points. Points are one possible mechanism. If the buyer does not renew, no number of points rescues the account, and if the product keeps delivering value, many accounts renew without any reward at all. The ways to keep customers beyond rewards are in customer success strategy and customer retention examples.
Reichheld and Sasser argued as early as 1990 that keeping customers is where much of a service company's profit comes from, which is why renewal is the number to organise the program around.
Types of B2B loyalty programs
Seven designs cover most programs. Choose by what you want the customer to do.
| Type | How it works | Works when | Main risk |
|---|---|---|---|
| Tiered status | Accounts earn tiers by spend or usage, each with more access | Purchases are frequent and customers compare themselves | Tiers become entitlements that are hard to withdraw |
| Rebates and volume discounts | A price break after committed volume | You sell repeatable goods with measurable volume | Trains customers to wait for the discount |
| Points and rewards | Points for purchases, redeemed for rewards | Individual buyers choose purchases and may accept rewards | Buyer or company rules may prohibit personal gifts |
| Partner and reseller programs | Margin and support tied to partner performance | Partners sell or implement for you | Rewards volume over customer outcome |
| Customer advisory board | Selected customers shape the roadmap | Few, large, strategic accounts | Only covers a handful of customers |
| Success and executive programs | Named contacts, reviews and training for key accounts | Accounts are large enough to justify human time | Does not scale beyond top accounts |
| Referral and advocacy | Rewards or recognition for introductions and references | Customers are happy and well networked | Rewards without happiness bring poor referrals |
Most working programs combine two or three. Notice what the strongest ones reward: access, influence and time with your people, not trinkets.
Why renewal and expansion beat points
Three differences between B2B and consumer buying explain it.
- The person who benefits is not the person who pays. A user may love a reward, but renewal is decided by whoever owns the budget and judges value delivered. A reward for the user does not change that judgement.
- Contracts set the clock. Annual or multi-year terms mean most of the loyalty decision happens once or twice a year, at renewal. Rewards offered between renewals have little to act on.
- Rules may limit gifts. Many companies restrict what employees can accept from suppliers. Check the rules of the customers you target before designing anything that looks like a personal reward.
The rewards that survive these constraints deliver business value: a seat at a roadmap review, a faster support tier, free training for new hires, a loyalty discount tied to a longer term, or joint case-study visibility. They make staying cheaper or better for the company, not just more pleasant for one person.
The metrics that show whether it works
Measure outcomes at the account level, in money and in counts.
| Metric | Formula | What it answers |
|---|---|---|
| Gross revenue retention (GRR) | (Starting revenue − churn − contraction) ÷ starting revenue | How much of last year's revenue is still here, ignoring upsell? |
| Net revenue retention (NRR) | (Starting revenue − churn − contraction + expansion) ÷ starting revenue | Does the existing base grow without new logos? |
| Logo retention | Accounts still active ÷ starting accounts | How many customers did we keep? |
| Adoption depth | Active users or key actions per account | Is the product embedded enough to be hard to remove? |
| Advocacy | Referrals or reference calls per 100 accounts | Will customers put their name to us? |
Sample data: a company starts the year with 100 accounts and $1,000,000 in annual recurring revenue. During the year, 8 accounts leave, taking $80,000; others downgrade for $40,000 in total; and upgrades add $150,000.
- NRR = (1,000,000 − 80,000 − 40,000 + 150,000) ÷ 1,000,000 = 103.0%.
- GRR = (1,000,000 − 80,000 − 40,000) ÷ 1,000,000 = 88.0%.
- Logo retention = (100 − 8) ÷ 100 = 92.0%.
NRR above 100% means the base grew even after losing 8 accounts. GRR shows the leak that expansion covered up. Definitions differ between companies, for example in whether they use revenue or annual recurring revenue and how they treat churn, so write yours down; the term is explained in net revenue retention.
| Metric | Formula | What it answers |
|---|---|---|
| Gross revenue retention | (Start − churn − contraction) ÷ start | How much revenue is left, ignoring upsell? |
| Net revenue retention | (Start − churn − contraction + expansion) ÷ start | Does the existing base grow without new logos? |
| Logo retention | Active accounts ÷ starting accounts | How many customers did we keep? |
| Adoption depth | Active users or key actions per account | Is the product embedded enough to stay? |
Write down whether you use revenue or annual recurring revenue, and how you treat churn.
How to design a B2B loyalty program
Work through five steps, in order.
- Pick the segment. Start with accounts large enough to justify attention, such as the top 20% by revenue, and name the behaviour you want: renew early, add seats, introduce peers.
- Define the loyal behaviour as a number. For example "at least 60% of purchased seats active in the last 30 days" or "has renewed for at least two terms." Tie tier thresholds to behaviour, not only spend.
- Choose rewards that deliver business value. Access to the roadmap, a faster support tier, training credits, a discount for a longer term. Check each against the customers' gift and procurement rules.
- Decide the cost cap. Set the program budget as a share of the revenue you expect to protect, before launch.
- Plan the measurement. Decide in advance how you will compare members with a fair baseline, as in the next example.
Worked example: judging a tier program fairly
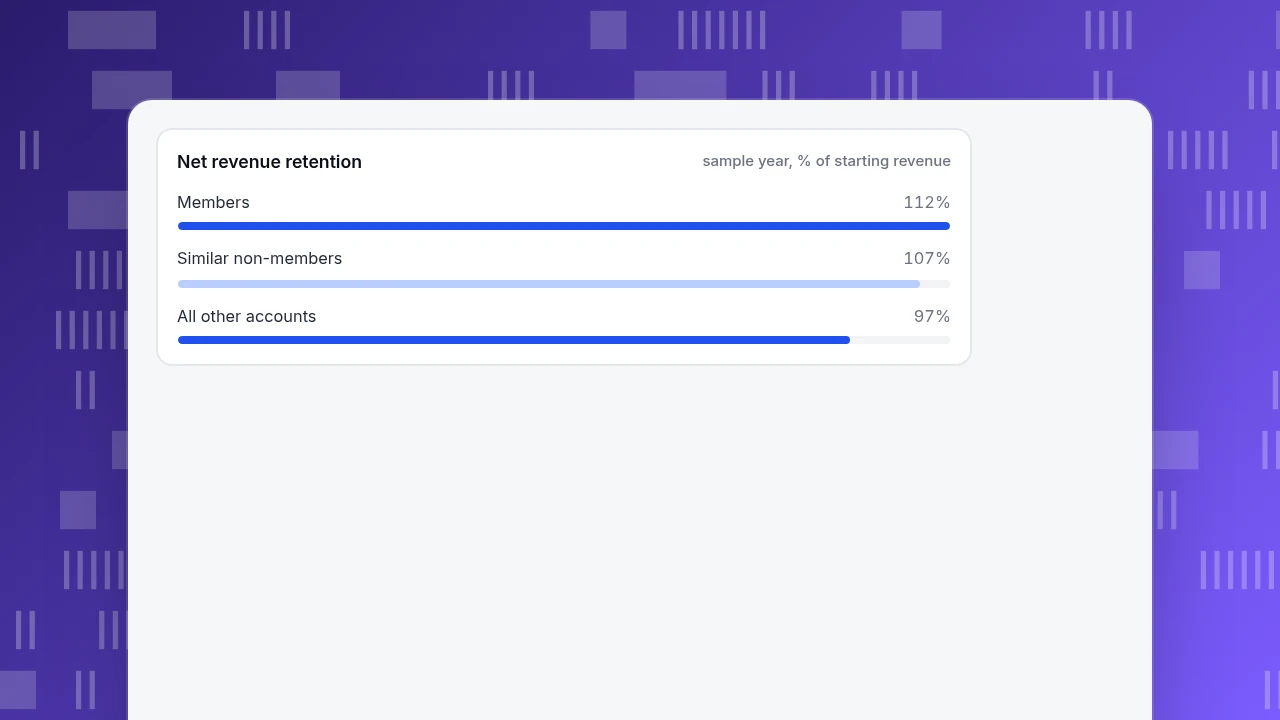
Sample data: a tier program covers 20 of the 100 accounts, which started the year with $400,000 of the $1,000,000. Members ended the year at $448,000, an NRR of 448 ÷ 400 = 112%. The other 80 accounts started at $600,000 and ended at $582,000, an NRR of 97%. The program costs $35,000.
The naive reading is a 15-point gap on $400,000: 400,000 × (112% − 97%) = $60,000 of extra revenue, so a return of (60,000 − 35,000) ÷ 35,000 = 71.4%.
That ignores selection. Members joined because they were already big and engaged; they were likelier to expand anyway. Suppose you compare them with 20 non-members of similar size and usage, whose NRR was 107%. The fair gap is 5 points: 400,000 × (112% − 107%) = $20,000, and the return is (20,000 − 35,000) ÷ 35,000 = −42.9%.
The same program looks like a 71.4% gain or a 42.9% loss depending on the comparison. The answer is not to abandon the program but to measure it against like-for-like accounts, or to offer it to a random half of eligible accounts and compare. A program can also be worth running at a loss on revenue if it protects strategic accounts, but then say so openly.
Net revenue retention
sample year, % of starting revenueCommon mistakes in B2B loyalty programs
- Copying a consumer points scheme. The user who earns points is rarely the person who decides to renew.
- Rewarding spend alone. A large account with 20% of its seats active is a churn risk with a gold badge.
- Measuring the members against everyone else. The gap in the example was three times larger than the real effect.
- Launching without a cost cap. Discounts and perks quietly erode the margin they were meant to protect.
- Ignoring the buyer's rules. A reward the recipient cannot accept is a cost with no effect.
- Running a program instead of fixing the product. If customers leave because the product fails them, no reward holds them.
How TapCub helps you see account retention
Take the 100-account company above. TapCub does not run the program, but it shows whether customers are using the product enough to renew.
- Group people into accounts. After a user logs in, call
tapcub.group('company', 'acme', {...})so members roll up under their account. Open All-platform analytics › Users › Accounts for account counts, 30-day active accounts and members. Anonymous visitors never join an account. - Read the health score. Each account gets a 0–100 score: active members in 30 days (40 points), active days (30) and recency (30 within 7 days, 15 within 30). Sort by Health to find large accounts with thin adoption.
- Track retention by cohort. In All-platform analytics › Behavior › Behavior analysis, check how many accounts that started in a given month are still active in later periods.
- Record revenue events. Install the B2B / SaaS pack from All-platform analytics › Business › Industry packs; it expects subscription events with plan and MRR, sent from your server.
- Know the boundary. TapCub does not run points, tiers or rewards, does not hold your CRM or contracts, and does not produce NRR for you. Compute NRR from your billing data, and use TapCub to see the behaviour behind it.
FAQ
What is a B2B loyalty program?
A structured way to reward business customers for renewing, buying more and recommending you. It differs from consumer loyalty because the buyer spends company money, so value delivered and access matter more than points or personal gifts.
What are examples of B2B loyalty programs?
Tiered status with more access at higher tiers, volume rebates, partner and reseller programs, customer advisory boards, executive and success programs for key accounts, and referral programs. Most working programs combine two or three of these.
How do you measure the success of a B2B loyalty program?
Compare gross and net revenue retention, logo retention, adoption depth and referrals for members against similar non-members. In the example, comparing against all non-members suggested a 71.4% return; against similar accounts it was −42.9%.
Do points-based loyalty programs work in B2B?
Sometimes, where individual buyers choose purchases and may accept rewards, but they are a poor fit when renewal is decided by a budget owner. Check the customer's gift rules, and prefer rewards that deliver business value such as access, training or support.
See also: Customer Appreciation: Specific, Timely and Checked Against a Holdout.
See also: Customer Incentive Programs: Types, Costs and How to Measure Them.
Sources
- Frederick F. Reichheld & W. Earl Sasser Jr. Zero Defections: Quality Comes to Services. Harvard Business Review, September 1990 — retention as a driver of service-company profit. Verified 2026-11-19 (summary page).
- Frederick F. Reichheld. The One Number You Need to Grow. Harvard Business Review, December 2003 — willingness to recommend as a growth signal. Verified 2026-11-19.
- Zscaler, Inc. Form 10-K for the fiscal year ended 31 July 2021 — an example of a published net retention rate definition based on cohort recurring revenue. Verified 2026-11-19.
Was this article helpful?
We use your answers to fix and expand this page.
Couldn’t send. Please try again in a minute.
Thanks for the feedback. We’ll use it to improve this page.You’ve already sent feedback on this page. Thanks.

Product Analyst
Focuses on event analysis, conversion funnels, and retention, using clear metric definitions and structured analysis to explain product performance.