Try it on your own data
Every report in this article is in the free plan. One snippet for web and apps, up to 10 sites.
Start freeA SaaS sales funnel is the staged path from visitor to paying customer, and the trial sits in the middle: visitor → sign-up → activated → paid for self-serve products, with lead, qualified and opportunity added when sales is involved. Read each stage separately. A loss before activation has nothing to do with sales. Below: stage definitions, a worked 10,000 → 30 example and the traps.
What you will learn
- Read each stage on its own: sign-up, activation and paid conversion respond to different causes
- A flat total rate can hide a broken funnel: two months can both give 0.3% with activation down from 30% to 20%
- Pick the stage to fix by its gap to your best channel, and report self-serve and sales-assisted separately
The SaaS sales funnel has a trial in the middle
A traditional sales funnel runs from lead to deal. A SaaS funnel has an extra stage in the middle, where the prospect uses the product before paying, and that stage changes how you read everything else. The funnel for a self-serve product runs visitor → sign-up → activated → paid. The funnel for a sales-assisted product runs visitor → lead → qualified → opportunity → closed-won. In both, the product experience sits between the first contact and the money, and a prospect who never reaches the "aha" moment is lost before sales ever matters.
| Stage | Self-serve funnel | Sales-assisted funnel |
|---|---|---|
| 1 | Visitor | Visitor |
| 2 | Sign-up (account created) | Lead (form, demo request or trial sign-up) |
| 3 | Activated (key action done) | Qualified (meets your fit and usage rules) |
| 4 | Paid (first payment) | Opportunity (demo held, proposal sent) |
| 5 | Retained and expanding | Closed-won, then retained and expanding |
| Who moves the prospect | The product | The product first, then a salesperson |
| Stage rates to track | Sign-up rate, activation rate, paid conversion | Lead rate, qualification rate, win rate |
The funnel does not end at payment. Dave McClure's widely used startup metrics framework lists five stages: acquisition, activation, retention, referral and revenue (McClure). Retention is the one that decides whether acquisition was worth paying for. This guide covers the first half in detail: the stages from visitor to paid. For the broader marketing funnel see marketing funnel, and for tactics to improve any stage see conversion funnel optimization.
The main idea of this guide: read each stage separately, and put the trial in the middle. The share of visitors who sign up, the share of sign-ups who activate and the share of activated users who pay respond to different causes, and a loss before activation has nothing to do with the sales team.
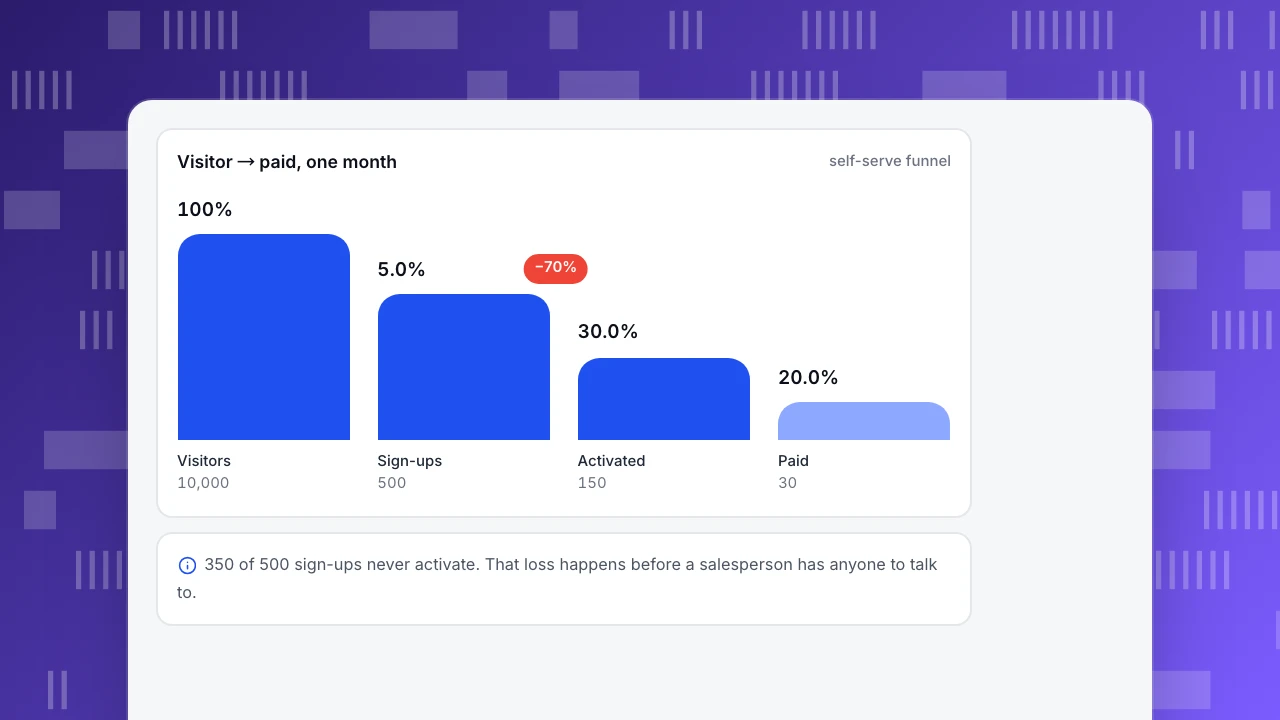
Worked example: 10,000 visitors, 500 sign-ups, 150 activated, 30 paid
Sample data: one month of a self-serve SaaS funnel.
- Visitors to sign-ups: 500 ÷ 10,000 = 5.0%.
- Sign-ups to activated: 150 ÷ 500 = 30.0%.
- Activated to paid: 30 ÷ 150 = 20.0%.
- Visitor to paid, overall: 30 ÷ 10,000 = 0.3%, which equals 5.0% × 30.0% × 20.0%.
Where does one more point of conversion buy the most? Add one percentage point to each stage, one at a time:
| Change | New stage rate | Paid customers | Gain |
|---|---|---|---|
| Baseline | 5.0% / 30.0% / 20.0% | 30.0 | |
| Sign-up rate 5.0% → 6.0% | 6.0% | 10,000 × 6% × 30% × 20% = 36.0 | +6.0 (+20%) |
| Activation rate 30.0% → 31.0% | 31.0% | 500 × 31% × 20% = 31.0 | +1.0 (+3.3%) |
| Paid conversion 20.0% → 21.0% | 21.0% | 150 × 21% = 31.5 | +1.5 (+5%) |
A point on the sign-up rate adds 6 customers; a point on activation adds 1. That is because the funnel is a product of rates: a point is a bigger relative change on a small rate. A better comparison is the room each stage has. Suppose your best channel, by breakdown, reaches 8% sign-up, 40% activation and 25% paid conversion (sample figures). Then lifting each stage alone to that level gives:
- Sign-up to 8%: 10,000 × 8% × 30% × 20% = 48 paid (+18).
- Activation to 40%: 500 × 40% × 20% = 40 paid (+10).
- Paid conversion to 25%: 150 × 25% = 37.5 paid (+7.5).
If all three matched the best channel, the result would be 10,000 × 8% × 40% × 25% = 80 paid, 2.7 times the baseline. The gap between your average and your best segment is evidence of what is achievable, and it points at the stage to work on first. Effort differs by stage, so weigh gain against cost, but start from the numbers.
Why one total conversion rate hides the problem
A single visitor-to-paid rate can stay flat while the funnel breaks. Sample data: month B has a big campaign.
| Visitors | Sign-up rate | Activation rate | Paid conversion | Paid | Total rate | |
|---|---|---|---|---|---|---|
| Month A | 10,000 | 5.0% | 30.0% | 20.0% | 30 | 0.3% |
| Month B | 10,000 | 7.5% | 20.0% | 20.0% | 30 | 0.3% |
Both months give 30 paid customers and 0.3%. In month B, sign-ups rose from 500 to 750 (10,000 × 7.5%) while activation fell from 30% to 20%, so activated users stayed at 150 (750 × 20%). The campaign brought many people who were less likely to get value. A single total rate calls this "no change"; the stage view shows an onboarding or targeting problem. If those extra sign-ups also ask for support and free-plan resources, month B is more expensive than month A at the same output.
How to define each stage so the numbers are comparable
Rates only compare if the stage definitions are fixed. Use this table as a checklist:
| Stage | Define it as | Identity | Common error |
|---|---|---|---|
| Visitor | A unique visitor in the period, bots excluded | Visitor | Counting crawlers and AI bots as prospects |
| Sign-up | The account-created event, once per person | Visitor becomes a person at login | Counting form views, or duplicate sign-ups |
| Activated | The one action that predicts retention, within a set window | Person | Using page views (a login) instead of an action |
| Paid | First successful payment | Person or account | Counting trials started as paid |
| Qualified (sales-assisted) | Fit rule plus a usage rule, written down | Person or account | Letting each salesperson decide |
To choose the activation event, compare candidates by how many people reach them and how much better they retain. Sample data from another cohort, with overall 30-day retention of 30%:
| Candidate event, within 7 days | Share who do it | 30-day retention, did | 30-day retention, did not | Gap |
|---|---|---|---|---|
| Created a first project | 60% | 45.0% | 7.5% | 37.5 points |
| Invited a teammate | 20% | 70.0% | 20.0% | 50.0 points |
| Viewed the dashboard | 80% | 32.5% | 20.0% | 12.5 points |
Viewing the dashboard reaches many people but separates little. Inviting a teammate separates the most but only 20% do it, so it is better treated as a later milestone. "Created a first project" has both reach and a gap, which makes it a sound activation event. Remember that the people who do these things are different people, so the gap is a correlation; confirm it by changing onboarding to push the event and watching whether retention follows. The idea of choosing by gap and reach is in activation rate.
Where self-serve ends and sales begins
Many B2B SaaS products run both: most customers buy alone, and a few larger accounts talk to a salesperson. The hand-off needs a rule. In the sample month, the 150 activated users split into two groups:
- 20 meet a product-qualified rule (sample: activated, with at least three active teammates). They go to sales, which closes 6, so 6 ÷ 20 = 30.0%.
- The other 130 stay self-serve and 24 pay: 24 ÷ 130 = 18.5%.
- Together 6 + 24 = 30 paid, the same total as before.
| Group | Activated | Paid | Rate |
|---|---|---|---|
| Product-qualified, sales-assisted | 20 | 6 | 30.0% |
| Everyone else, self-serve | 130 | 24 | 18.5% |
| Total | 150 | 30 | 20.0% |
Report the two paths separately, because they have different costs and different stage rates. Mixing them hides whether the sales effort is worth it. The qualification rule is yours to define; the concept is in product-qualified lead. For how to find leads before they reach the trial, see SaaS lead generation.
Losses before activation are not a sales problem
In the example, 350 of 500 sign-ups, 70%, never activated, while 120 activated users, 80% of them, did not pay. The larger pool of lost people is before activation, where a salesperson has nothing to work with: the person never used the product. Fixing that is onboarding work.
Two measurements help. First, the median time between sign-up and activation. In a sample where the median is 6 days and 25% of those who activate take more than 12 days, while the trial lasts 14 days, many people are activating at the edge of the trial; shorten the path to the key action. Second, where people stop between sign-up and activation: a step-level drop shows whether the problem is the first screen, a missing integration or an empty state. Count activation as a fixed window (for example within 14 days of sign-up), and keep the same window every month.
Mapping the B2B SaaS marketing funnel to these stages
A B2B SaaS marketing funnel usually uses awareness, consideration and decision. These stages are not events, so map them to things you can count:
| Marketing stage | What you can measure | Funnel stage it feeds |
|---|---|---|
| Awareness | Visitors by channel and campaign | Visitor |
| Consideration | Two or more visits within 14 days; pricing, docs or case-study views | Visitor, then sign-up |
| Decision | Sign-up, trial start, demo request | Sign-up or lead |
Use the marketing stages to decide what content to write; use the funnel stages to decide what to measure. If the two lists do not map one-to-one, the funnel is the one to trust, because it is built from events.
Mistakes that make a SaaS funnel misleading
- Using one total rate. The month A and B example: the same 0.3%, with the activation rate down by a third.
- Counting sign-ups as leads. A free sign-up costs the product, not a salesperson. Put sign-ups in the funnel, and let qualified mean something stricter.
- Mixing a period with a cohort. In March, 30 people paid, but only 21 of them signed up in March; the other 9 signed up in February. Dividing 30 by March's 500 sign-ups gives 6.0%, while March's cohort has converted 21 ÷ 500 = 4.2% so far. Follow each sign-up cohort over a fixed window.
- Stopping the funnel at payment. A paid customer who leaves in month 3 was acquisition cost without a return. Add a retention stage.
- Defining stages differently each quarter. If activation changes from "created a project" to "invited a teammate", the history stops being comparable. Version the definition and keep the old series.
How to read a SaaS funnel in TapCub
Take the 10,000 → 500 → 150 → 30 funnel and build it in TapCub.
- Make sure the events exist. You need a sign-up event, your activation event and a paid event. Call
tapcub.login()after sign-up so the visitor becomes a person with a profile; funnels use person identity by default. If you want the paid step in the same funnel, send a payment event from your backend through the server API. - Build the funnel. Go to All-platform analytics › Behavior › Behavior analysis, which opens on funnels. Add the steps (2 to 20 allowed), and set the window to cover the trial plus a few days (the default is 7 days, the maximum 180). Each step shows its count, the rate against step one, the rate against the previous step, the drop-off and the median time from the previous step; the largest drop is marked.
- Break it down by channel. Use the breakdown to compare channels; it keeps the 10 groups with the most entries. The best channel gives you the stage targets used in the example.
- Open the people at a drop. Click a step to see who arrived and who dropped there, open a profile in All-platform analytics › Users › People, and save a rule segment such as "signed up but did not activate in 7 days" in All-platform analytics › Users › Segments & tags for follow-up.
- Follow the cohort to retention. Open retention with the activation event as the start event to see whether the activated group is still there at week 4. For sales-assisted accounts, switch identity to account.
TapCub does not hold a CRM, lead scores or a sales pipeline, so demo and closed-won stages live in your CRM, and the qualification rule is yours. It measures what happens on the site and in the product.
FAQ
What is a SaaS sales funnel?
It is the staged path from first visit to paying customer. A self-serve funnel runs visitor, sign-up, activated, paid. A sales-assisted funnel runs visitor, lead, qualified, opportunity, closed-won. The trial or product experience sits in the middle, and each stage has its own conversion rate.
What are the stages of a B2B SaaS sales funnel?
Typically visitor, lead, qualified lead (often a product-qualified lead), opportunity and closed-won, followed by retention and expansion. For self-serve products, the middle stages are sign-up and activation. Keep stage definitions fixed so rates can be compared month to month.
What is a good SaaS funnel conversion rate?
There is no reliable universal figure. Rates depend on price, audience and channel. Compare your stages with your own best channel and with your previous cohorts; in the sample, matching the best channel would more than double paid customers. Track each stage separately rather than one total.
How is a SaaS sales funnel different from a marketing funnel?
A marketing funnel describes stages of awareness and consideration, which are hard to observe directly. A SaaS sales funnel is built from events you can count: visit, sign-up, activation and payment. Use the marketing funnel to plan content and the sales funnel to measure results.
How do you improve a SaaS sales funnel?
Find the stage with the most room by comparing it with your best channel, then work on that stage. Losses before activation are fixed by onboarding, not by sales. Report self-serve and sales-assisted paths separately, and follow each sign-up cohort over a fixed window.
See also: Sales Funnel Optimization: Find the Leak Before You Fix It.
See also: B2B Sales Cycle: How to Find the Stage Where Deals Stall.
See also: Product Demos: Show the Buyer's Scenario, Not Every Feature.
See also: B2B SaaS Conversion Rates: Benchmarks by Funnel Stage.
See also: What is pipeline velocity? Formula and a four-variable example.
Sources
- Dave McClure. Startup Metrics for Pirates. Presentation, November 2010. The five stages acquisition, activation, retention, referral and revenue. Read 2026-11-17.
- Slack Technologies, Inc. Form S-1, 2019. Notes that not all organisations on the free version convert to paid. Read 2026-11-17.
Was this article helpful?
We use your answers to fix and expand this page.
Couldn’t send. Please try again in a minute.
Thanks for the feedback. We’ll use it to improve this page.You’ve already sent feedback on this page. Thanks.

Product Experience Specialist
Explores usability, user journeys, and feature adoption through practical examples of onboarding and everyday product use.