Try it on your own data
Every report in this article is in the free plan. One snippet for web and apps, up to 10 sites.
Start freeB2B SaaS conversion rates depend on the funnel: ChartMogul's 2026 survey finds 3.5% to 9% of visitors sign up and a median 8% of free users pay within six months, while First Page Sage's sales-led stages multiply to 3.7 customers per 10,000 visitors for a $10–100M company. Below: the stage table, the multiplication and how to pick the stage to fix.
What you will learn
- Self-serve and sales-led funnels have different stages: compare each stage only with its own funnel
- Stage rates multiply: a card-required trial gets fewer signups but 10.5 customers per 1,000 visitors against 3.6
- Fix the stage with the lowest ratio to benchmark and the largest downstream effect, after checking the count is large enough
What are typical B2B SaaS conversion rates at each stage?
There is no single B2B SaaS conversion rate, because a SaaS company can sit on two different funnels. A self-serve product moves visitors to signups to paying customers, usually inside the product. A sales-led product moves visitors to leads to marketing-qualified leads (MQLs) to sales-qualified leads (SQLs) to opportunities to closed deals. The two published datasets below cover each funnel, and a third gives a cross-check on website-to-lead rates by channel.
| Stage | Published figure | Source and what it covers |
|---|---|---|
| Visitor to signup, freemium | 9% | ChartMogul SaaS Conversion Report (Feb 2026, 200 B2B products), per website visitor |
| Visitor to signup, free trial without card | 4.5% | Same report |
| Visitor to signup, free trial with card | 3.5% | Same report |
| Free to paid within 6 months, overall | 8% median | Same report |
| Free to paid, trial with card | 30% average (good 25–35%, great 50–60%) | Same report; "good" is the 50th percentile, "great" the 75th |
| Visitor to lead, sales-led | 2.3% / 1.4% / 1.2% / 0.7% | First Page Sage (June 2025, 50+ B2B SaaS clients) by company size: $1–10M / $10–100M / $100M–1B / $1B+ |
| Lead to MQL | 37% / 41% / 40% / 34% | Same, same four sizes |
| MQL to SQL | 32% / 39% / 39% / 40% | Same |
| SQL to opportunity | 40% / 42% / 46% / 36% | Same |
| Opportunity to close | 46% / 39% / 35% / 31% | Same |
| Website session to qualified lead, B2B tech | 2.5% organic, 1.5% paid search, 1.9% referral, 0.3% social | Ruler Analytics (2025 full year), conversion = qualified lead by form or call |
Two cautions apply before you copy any of these into a plan. First Page Sage does not label what each channel-table row measures; its industry and company-size tables do use stage-to-stage labels such as "Visitor to Lead", and the rows above are read the same way. And its data comes from an agency's own client base of small and mid-sized companies, so treat it as a published range rather than a market measurement. The ChartMogul report is a survey of 200 products, with conversion measured as the share of leads or signups who become customers within six months.
For trial-specific detail see free trial conversion rate, and for the stages themselves SaaS sales funnel.
| Stage | Published figure | Source |
|---|---|---|
| Visitor to signup, free trial no card / with card | 4.5% / 3.5% | ChartMogul (Feb 2026) |
| Free to paid, median / card-required trial | 8% / 30% | ChartMogul (Feb 2026) |
| Visitor to lead, $10–100M company | 1.4% | First Page Sage (June 2025) |
| Lead to MQL / MQL to SQL | 41% / 39% | First Page Sage, $10–100M |
| SQL to opportunity / opportunity to close | 42% / 39% | First Page Sage, $10–100M |
First Page Sage is agency client data; ChartMogul is a survey of 200 products with a six-month window.
How do the stage rates multiply into customers?
Each rate looks healthy alone; the product of all of them is small. Multiplying the rates is the quickest way to see what a funnel yields.
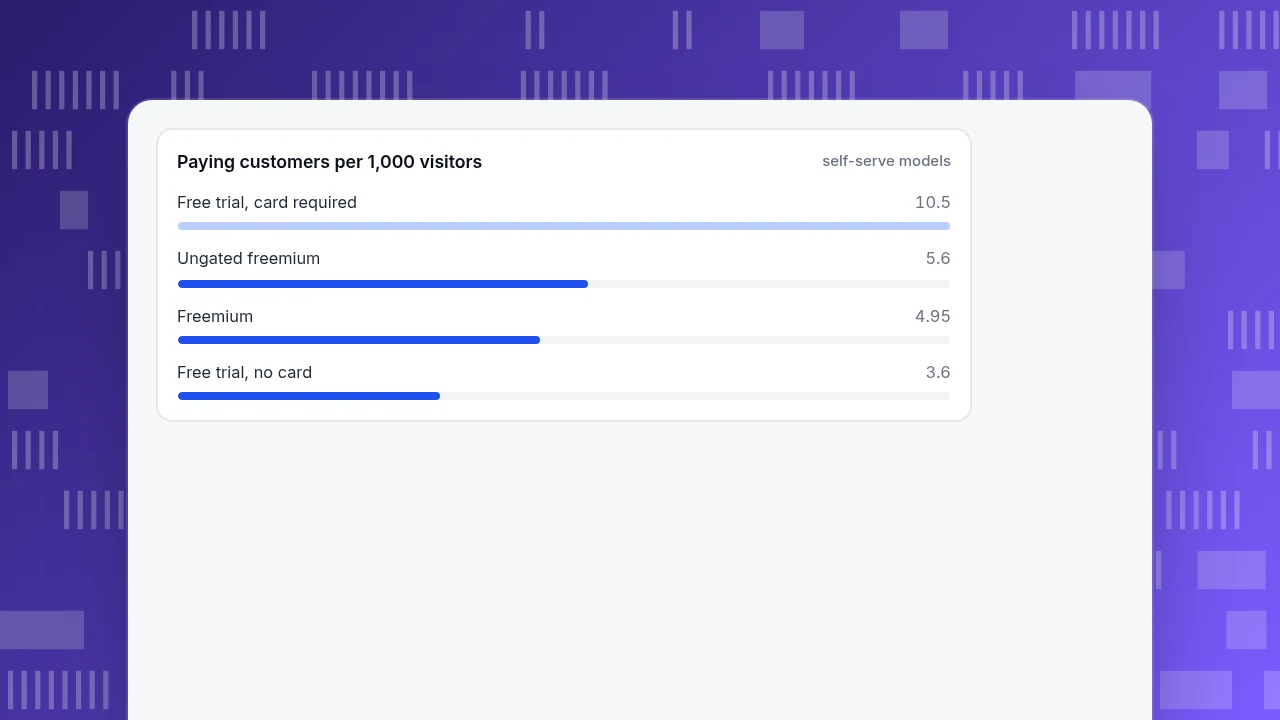
Self-serve, per 1,000 website visitors (ChartMogul's own funnel table):
| Model | Signups | Free-to-paid | Paying customers | Visitor to paid |
|---|---|---|---|---|
| Freemium | 90 | 5.5% | 4.95 | 0.50% |
| Ungated freemium | 70 | about 8% | 5.6 | 0.56% |
| Free trial, no card | 45 | 8% | 3.6 | 0.36% |
| Free trial, card required | 35 | 30% | 10.5 | 1.05% |
The card-required trial gets fewer signups (35 against 45) but nearly three times the customers (10.5 against 3.6), because the free-to-paid rate is almost four times higher (30% against 8%). The visitor-to-signup rate alone would have ranked the models in the opposite order.
Sales-led, per 10,000 visitors, using First Page Sage's stage rates for each company size and multiplying visitor to lead × lead to MQL × MQL to SQL × SQL to opportunity × opportunity to close:
| Company size | Customers per 10,000 visitors | Visitor to customer |
|---|---|---|
| $1–10M revenue | 5.0 | 0.050% |
| $10–100M | 3.7 | 0.037% |
| $100M–1B | 3.0 | 0.030% |
| $1B+ | 1.1 | 0.011% |
For the $10–100M row: 10,000 × 1.4% = 140 leads; × 41% = 57.4 MQLs; × 39% = 22.4 SQLs; × 42% = 9.4 opportunities; × 39% = 3.7 customers. Because the product is so small, a single one-point change in the weakest stage can matter more than a large change somewhere the rate is already high.
Paying customers per 1,000 visitors
self-serve modelsWhat counts as good at each stage?
ChartMogul gives the clearest answer because it prints percentile bands: "good" is the median and "great" is the 75th percentile. For free-to-paid conversion, good and great are 3–5% and 8–12% for freemium, 4–6% and 10–15% for a trial without a card, and 25–35% and 50–60% with a card. The report also shows the spread is wide: for free trials, 20% of products convert below 2.5% and 23% convert above 25%.
First Page Sage does not publish percentiles, so its figures say what a typical client saw, not what the top quartile saw. When you compare, label your own number the same way: a figure at or just above the median is not yet "great" in ChartMogul's terms.
A usable reading rule: within a 20% band of the benchmark, treat the stage as on par; below 80% of it, treat it as a candidate to fix; above 120%, check that you have not counted the stage too loosely. This band is a planning judgement, not a published threshold, so adjust it to your volume.
Which stage should I fix first?
Compare each stage with its benchmark, then compute what happens to customers if that one stage alone reached the benchmark. The second step matters because a stage near the end multiplies everything before it.
Sample data: a company with $10–100M revenue (the First Page Sage benchmark column) records 20,000 visitors, 240 leads, 84 MQLs, 30 SQLs, 12 opportunities and 3 customers in a quarter.
| Stage | Your rate | Benchmark | Ratio to benchmark | Customers if only this stage hits benchmark |
|---|---|---|---|---|
| Visitor to lead | 1.20% (240 ÷ 20,000) | 1.4% | 0.86 | 3.50 |
| Lead to MQL | 35.0% (84 ÷ 240) | 41% | 0.85 | 3.51 |
| MQL to SQL | 35.7% (30 ÷ 84) | 39% | 0.92 | 3.28 |
| SQL to opportunity | 40.0% (12 ÷ 30) | 42% | 0.95 | 3.15 |
| Opportunity to close | 25.0% (3 ÷ 12) | 39% | 0.64 | 4.68 |
Customers when a stage is fixed = 3 × benchmark ÷ your rate. Closing is the weakest stage by ratio (0.64) and also the biggest lever: reaching 39% lifts customers from 3 to 4.68, a 56% increase, against 17% for either of the first two stages. But with only 12 opportunities the closing rate is 3 ÷ 12 and a single deal moves it by 8 points, so before reworking sales, check whether that rate is stable across several quarters. Small counts make a low ratio noise, not a diagnosis.
Why don't my numbers match the published ones?
Most mismatches come from definitions rather than performance. Check these before concluding anything.
- What is a lead? First Page Sage defines a lead as any non-spam visitor who submitted contact information, and an SQL as an MQL who says the product is desirable, within budget and who is talking to a salesperson. If your team defines an MQL by a score threshold, your lead-to-MQL rate will not be comparable.
- What is the measurement window? ChartMogul measures free-to-paid within six months. If you measure within 14 days, you will look worse than a benchmark that waited. The same report says 62% of free trial products use a 14-day trial, 14% use 7 days and 14% use 30 days.
- Who is in the denominator? Ruler Analytics defines a conversion as a qualified lead or sale, captured by form or phone. If your analytics counts every form fill including support requests, your visitor-to-lead rate will be higher than theirs.
- How much do humans help? ChartMogul reports that 80% of free trial products and 70% of freemium products have human touchpoints for enterprise self-serve users. A "self-serve" rate that includes sales-assisted conversions is not comparable with one that excludes them.
- Is the traffic mixed? A site with mostly social traffic will convert far below one with mostly organic traffic (0.3% against 2.5% in Ruler's B2B tech row). Compare channel by channel.
How do I measure these stages in TapCub?
Take the sample company above: it can see 20,000 visitors and 240 leads, but not what the sales team did after the lead arrived. TapCub measures the website and product steps and leaves the CRM stages to your CRM.
- Define the website steps once. In Web analytics › Goals, set a goal for the form or demo request that counts as a lead, and for the signup if you run a self-serve product. The same data appears in All-platform analytics › Business › Goals.
- Build the funnel. In All-platform analytics › Behavior › Behavior analysis, create a funnel with two to twenty steps (for example pricing page, signup form, signup complete). It shows the count at each step, the rate against the previous step, the drop-off, and the median time from the previous step. The conversion window defaults to 7 days and can go up to 180, so choose it to match the sales cycle you are benchmarking against. See build a funnel.
- Split by source. Web analytics › Sources shows conversions by channel and UTM, so you can compare organic with paid with referral instead of quoting one blended rate. Bots and AI crawlers are counted separately and stay out of the visitor denominator.
- Bring in the later stages yourself. MQL, SQL, opportunity and close live in your CRM; TapCub is not a CRM and does no lead scoring. Take those counts from the CRM and divide them by TapCub's lead count to fill in the table in the previous section.
- Find the leak. Read the largest drop marked on the funnel first, then compare the stage with the benchmark column above.
FAQ
What is a good conversion rate for B2B SaaS?
It depends on the stage and the model. ChartMogul's median free-to-paid conversion is 8%, and 30% for trials that require a card. For sales-led funnels, First Page Sage lists visitor-to-lead rates of 0.7% to 2.3% depending on company size. Compare each stage with its own range, not one number.
What is the average B2B SaaS website conversion rate?
Published visitor-to-lead rates sit in the low single digits: 1.4% for $10–100M companies in First Page Sage's data, and 1.5% to 2.5% for B2B tech across organic, paid and referral channels in Ruler Analytics. Social traffic converts much lower, at 0.3%.
Which funnel stage should I improve first?
The one with the lowest ratio to its benchmark and the largest downstream effect. In the sample, closing at 25% against 39% would lift customers by 56%, more than twice any other stage. Confirm the rate is stable over several periods before acting on a small count.
Is a free trial with a credit card better?
It produces more customers per visitor in ChartMogul's data: 10.5 per 1,000 visitors against 3.6 without a card, because 30% convert against 8%. It also yields fewer signups (35 against 45), so compare on paying customers per visitor, not on signups.
Sources
- ChartMogul with Kyle Poyar and ProductLed. The SaaS Conversion Report — 200 B2B products, survey of January 2026, published 2026-02-04. Checked 2026-11-20.
- First Page Sage. B2B SaaS funnel conversion benchmarks — stage rates by channel, industry and company size from 50+ client engagements, updated 2025-06-11. Checked 2026-11-20.
- Ruler Analytics. Conversion rate benchmarks — 2025 channel conversion rates for B2B tech, published 2026-11-13. Checked 2026-11-20 (the site blocks some automated requests; opens in a browser).
Was this article helpful?
We use your answers to fix and expand this page.
Couldn’t send. Please try again in a minute.
Thanks for the feedback. We’ll use it to improve this page.You’ve already sent feedback on this page. Thanks.

Product Adoption Consultant
Explores customer onboarding, live conversations, and self-service, turning common usage questions into practical guidance and improvements.