Try it on your own data
Every report in this article is in the free plan. One snippet for web and apps, up to 10 sites.
Start freeB2B marketing analytics measures how marketing turns visitors into accounts, accounts into pipeline and pipeline into revenue, using definitions that sales and marketing share. Cover six kinds of metric, from stage conversion to sales velocity, and add an account view because several people at one company decide. In our sample quarter, 40,000 visits become 12 customers at a $12,500 CAC and a 6.25-month payback.
What you will learn
- Track volume, velocity, value, effectiveness, efficiency and engagement, not only visits and leads
- Report CAC with total sales and marketing cost, plus payback and sales velocity; marketing-only costs flatter marketing
- Group conversion by the month a lead was created: with a two-month cycle, same-month ratios understate a growing funnel by 36% in the sample
What is B2B marketing analytics, and how is it different?
B2B marketing analytics is the measurement of how marketing turns strangers into accounts, accounts into pipeline and pipeline into revenue, using one set of definitions that sales and marketing both accept. It differs from consumer analytics in three ways. The cycle is long, so many results arrive months after the spend. Several people at one company take part in the decision, so the account matters more than the individual visitor. And revenue lives in a CRM, not on the website, so web data has to be joined to it.
Buyers now do much of their research without talking to anyone. Gartner's 2025 survey of 632 B2B buyers, run in August and September 2024, found that 61% prefer an overall rep-free buying experience, 73% actively avoid suppliers who send irrelevant outreach, and 69% report inconsistencies between a supplier's website and what its sellers say (Gartner, June 2025). In other words, your website and marketing content carry a large share of the sale before sales ever hears about it. Measure them accordingly. For website-specific metrics see B2B website metrics; for credit assignment, B2B marketing attribution.
Six kinds of metric to cover
Forrester groups B2B marketing metrics into six categories: volume (how many opportunities sit at each stage), velocity (how long prospects take to move between stages), value (forecast revenue at each stage), effectiveness (conversion from one stage to the next), efficiency (how well tactics turn cost into return) and engagement (behavioural leading indicators). Its post, published in 2018, also reports that 92% of B2B marketing decision makers wanted to improve marketing ROI or effectiveness, and 77% said lacking the ability to measure results was among their top concerns (Forrester).
A useful check is that your dashboard has at least one metric from each category. Most teams over-index on volume (visits, leads) and under-measure velocity and efficiency.
The funnel table: metric, formula and sample numbers
Sample data: one quarter for a B2B software company with a 90-day average sales cycle.
| Stage | Metric | Formula | Sample |
|---|---|---|---|
| Top | Website visits | Counted by analytics (humans only) | 40,000 |
| Top | Visit-to-lead rate | Leads ÷ visits | 800 ÷ 40,000 = 2.0% |
| Middle | Lead-to-MQL rate | Marketing-qualified leads ÷ leads | 320 ÷ 800 = 40.0% |
| Middle | MQL-to-SQL rate | Sales-qualified leads ÷ MQLs | 96 ÷ 320 = 30.0% |
| Bottom | SQL-to-opportunity rate | Opportunities ÷ SQLs | 48 ÷ 96 = 50.0% |
| Bottom | Win rate | Closed-won ÷ opportunities | 12 ÷ 48 = 25.0% |
| Whole funnel | Lead-to-customer rate | Customers ÷ leads | 12 ÷ 800 = 1.5% |
| Whole funnel | Visit-to-customer rate | Customers ÷ visits | 12 ÷ 40,000 = 0.03% |
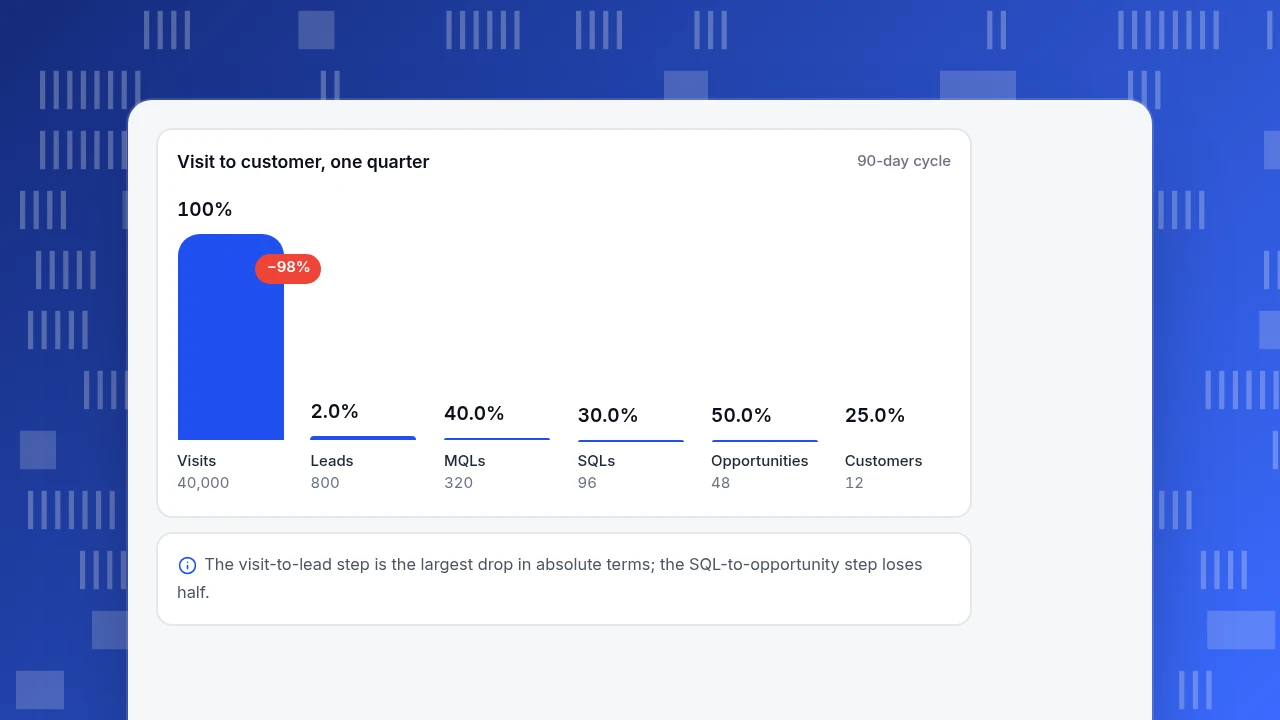
Read it from the largest leak. The lead-to-MQL step loses 60% of leads, but that may be correct filtering; the SQL-to-opportunity step loses half, which is a sales-and-marketing alignment conversation. A metric that looks poor may only mean your definition of MQL is loose, which is why the definitions need to be written down and shared.
Visit to customer, one quarter
90-day cycleVisits
40,000
Leads
800
MQLs
320
SQLs
96
Opportunities
48
Customers
12
Cost metrics: CAC, cost per lead and payback
Using the same quarter: marketing programme spend is $60,000 and sales cost is $90,000, so total sales and marketing cost is $150,000.
| Metric | Formula | Sample |
|---|---|---|
| Cost per lead | Marketing spend ÷ leads | $60,000 ÷ 800 = $75 |
| Cost per SQL | Marketing spend ÷ SQLs | $60,000 ÷ 96 = $625 |
| Cost per opportunity | Marketing spend ÷ opportunities | $60,000 ÷ 48 = $1,250 |
| Customer acquisition cost (CAC) | Total sales and marketing cost ÷ new customers | $150,000 ÷ 12 = $12,500 |
| CAC payback (months) | CAC ÷ (annual contract value × gross margin ÷ 12) | $12,500 ÷ ($30,000 × 0.80 ÷ 12) = 6.25 |
Marketing-only measures flatter marketing; CAC is defined as total sales and marketing cost divided by new customers acquired (MarTech Zone). Show both. For the full calculation see how to calculate CAC.
Sales velocity: one number that combines the funnel
Sales velocity is (opportunities × average deal value × win rate) ÷ length of the sales cycle, which gives revenue per day (Salesforce). With 48 opportunities, a $30,000 deal, a 25% win rate and a 90-day cycle: 48 × $30,000 × 0.25 ÷ 90 = $4,000 a day, or $360,000 a quarter, which equals 12 wins × $30,000.
Which lever moves it most? Change one at a time:
| Change | New velocity per day | Change in velocity |
|---|---|---|
| 10% more opportunities (53) | $4,400 | +10.0% |
| Win rate 25% to 30% | $4,800 | +20.0% |
| Deal value +10% | $4,400 | +10.0% |
| Cycle 90 to 75 days | $4,800 | +20.0% |
Winning more and shortening the cycle each give +20%, with only a five-point or fifteen-day move. Forrester files this family under velocity metrics, the second of its six categories.
| Stage | Metric | Formula | Sample |
|---|---|---|---|
| Top | Visit-to-lead rate | Leads ÷ visits | 800 ÷ 40,000 = 2.0% |
| Middle | Lead-to-MQL rate | MQLs ÷ leads | 320 ÷ 800 = 40.0% |
| Middle | MQL-to-SQL rate | SQLs ÷ MQLs | 96 ÷ 320 = 30.0% |
| Bottom | SQL-to-opportunity rate | Opportunities ÷ SQLs | 48 ÷ 96 = 50.0% |
| Bottom | Win rate | Closed-won ÷ opportunities | 12 ÷ 48 = 25.0% |
| Whole funnel | CAC | Sales and marketing cost ÷ new customers | $150,000 ÷ 12 = $12,500 |
Sample data: one quarter, 90-day average sales cycle, $30,000 deal, 80% gross margin.
Account-level metrics: count companies, not only people
One company may produce five leads and a single deal. Counting leads alone double-counts the effort. Add an account view for your target list.
Sample data: 1,000 target accounts in a quarter.
| Metric | Definition | Sample |
|---|---|---|
| Reach | Target accounts with at least one visit | 310 of 1,000 = 31.0% |
| Engaged accounts | Accounts with two or more known people active in 30 days | 180 of 1,000 = 18.0% |
| Engaged-to-opportunity | Opportunities from engaged accounts ÷ engaged accounts | 36 ÷ 180 = 20.0% |
Report accounts and leads side by side. If leads rise while engaged accounts fall, you are collecting more contacts from the same companies.
Attribution for a long cycle
B2B journeys span weeks, so single-touch credit misleads. Take one deal worth $30,000 with four touches: organic search on day 0, an email on day 20, paid search on day 41 and a direct visit on day 60 when the demo was booked.
| Model | Organic | Paid search | Direct | |
|---|---|---|---|---|
| First touch | $30,000 | $0 | $0 | $0 |
| Last touch | $0 | $0 | $0 | $30,000 |
| Linear | $7,500 | $7,500 | $7,500 | $7,500 |
| Position (40% first and last, 20% shared by the middle) | $12,000 | $3,000 | $3,000 | $12,000 |
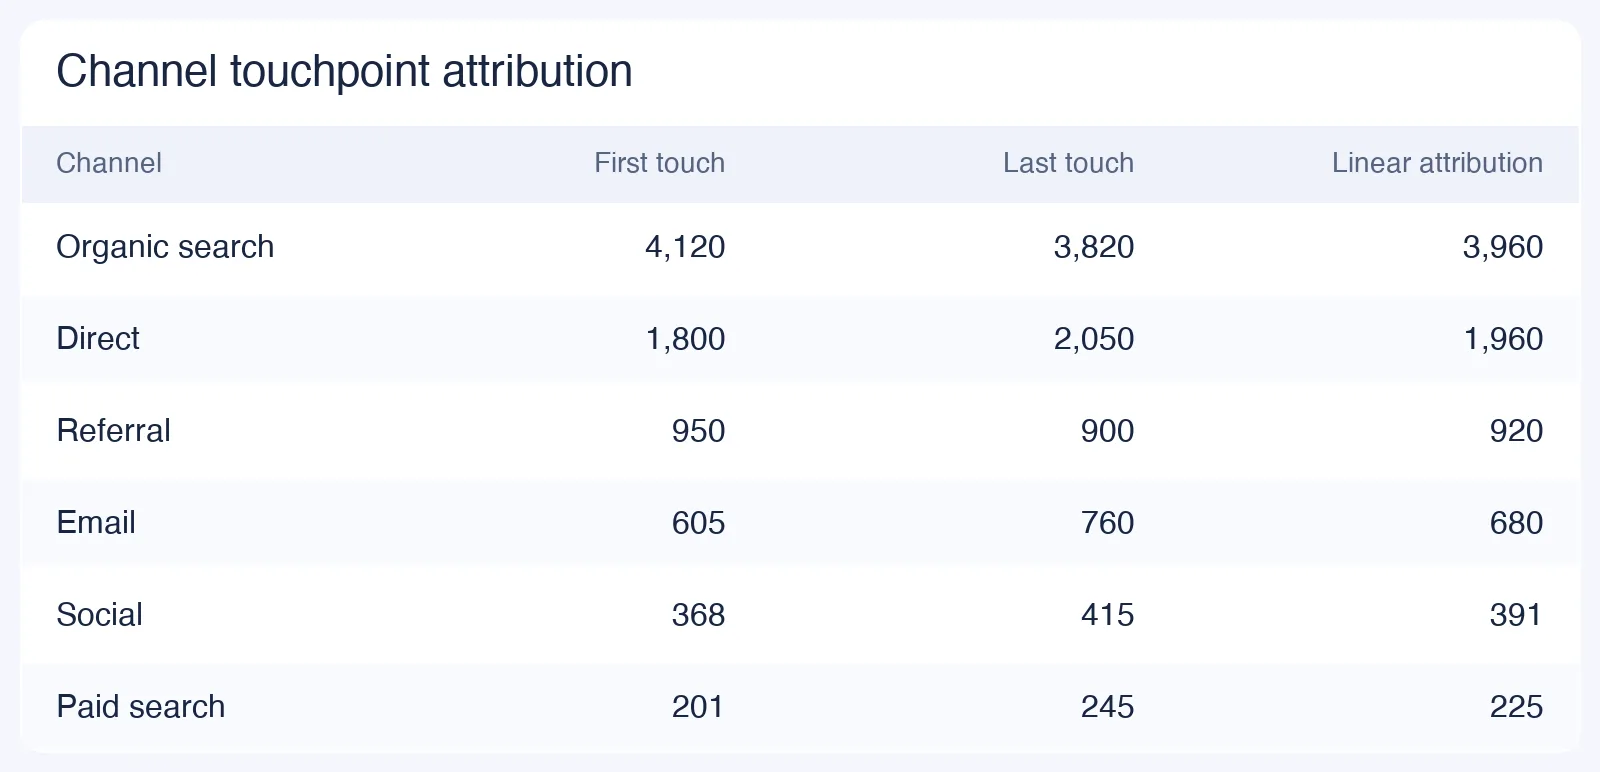
No model is right; they answer different questions. First touch rewards discovery, last touch rewards closing, and the middle touches only show up in linear and position models. Compare models side by side and look for channels that only appear when you leave first-touch and last-touch credit behind. The method is in multi-touch attribution; a TapCub report with the same side-by-side comparison follows.
A reporting rhythm that avoids the cohort trap
| Cadence | What to review | Question it answers |
|---|---|---|
| Weekly | Visits, leads, MQLs, engaged accounts | Is the top of the funnel healthy? |
| Monthly | Stage rates, cost per lead, pipeline created | Which channels create pipeline? |
| Quarterly | CAC, payback, sales velocity, win rate | Is growth efficient? |
One trap spoils the monthly view: dividing this month's wins by this month's leads. With a two-month cycle, wins in March come from leads created in January. If leads grew 25% a month (800, 1,000, 1,250), March shows 12 wins ÷ 1,250 leads = 0.96%, while the January cohort's real rate is 12 ÷ 800 = 1.5%. The same funnel looks 36% worse because the denominator grew. Group by the month the lead was created and follow each cohort.
Using TapCub for the web side of B2B analytics
Take the funnel table. TapCub measures the first half well: where the visits come from, what people do on the site and which accounts show up. It is not a CRM and does not score leads, send email or hold opportunity stages.
- Segment visits by source. Web analytics › Sources splits visitors by channel, referrer and UTM, with a conversions column. Name your UTM parameters consistently; name UTM parameters has the rules.
- Define the lead event as a goal. In Web analytics › Goals, make a demo-request form or sign-up the goal. Crawlers and AI bots are counted separately, so they do not inflate visits.
- Build the website funnel. In All-platform analytics › Behavior › Behavior analysis, build a funnel such as pricing page, demo form, form submitted and read the drop-off at each step.
- See the accounts. After login, call
tapcub.group('company', 'acme', { name: 'Acme' }). All-platform analytics › Users › Accounts shows the account count, 30-day active accounts, members and a 0–100 health score; anonymous visitors do not appear in accounts. - Compare attribution models. All-platform analytics › Behavior › Behavior analysis lets you select first-touch, last-touch, linear, position and time-decay models side by side, with a lookback window of 1 to 90 days (default 30). That is the table in the section above.
- Add spend. All-platform analytics › Business › Channel ROI accepts spend by day, channel, source or campaign.
Opportunity and closed-won come from your CRM. To see them next to site behaviour, send stage changes as server events through the HTTP interface. B2B lead generation covers capturing the lead itself.
FAQ
What is B2B marketing analytics?
It is the measurement of how marketing creates leads, accounts, pipeline and revenue for a business that sells to other businesses. It uses shared definitions with sales, tracks stage conversion and cost, and adds an account view because several people at one company take part in a purchase.
What metrics matter most in B2B marketing?
Cover volume, velocity, value, effectiveness, efficiency and engagement. In practice that means stage conversion rates, cost per lead and CAC, pipeline created, sales velocity and CAC payback, plus engaged accounts. One metric from each group beats ten from the first.
How do you calculate B2B marketing ROI?
Use pipeline or revenue sourced and influenced by marketing against marketing cost, and report CAC with total sales and marketing cost for the whole picture. In the sample, $150,000 of cost and 12 customers gives a $12,500 CAC and a 6.25-month payback at $30,000 ACV and 80% margin.
What is a good lead-to-customer conversion rate in B2B?
It depends on price, cycle and lead quality, and we found no primary-source benchmark we trust, so compare with your own history by cohort. In the sample the lead-to-customer rate is 1.5% and the win rate is 25%. Track the trend by the month leads were created.
How is B2B analytics different from B2C?
Cycles are longer, buying groups are involved, the account matters as well as the person, and revenue is booked in a CRM after months. So B2B analytics adds account views, cohort-based conversion, velocity metrics and an attribution view that spreads credit across several touches.
Sources
- Gartner, Gartner Sales Survey Finds 61% of B2B Buyers Prefer a Rep-Free Buying Experience (632 buyers, August–September 2024; press release 2025-06-25). Figures taken from the search-tool summary because the page returned 403 to automated fetches.
- Forrester, 6 Metrics That Matter For B2B Marketers (six categories; 92% and 77% survey figures; published 2018-04-19). Checked 2026-11-20.
- Salesforce, Sales velocity (formula and worked example). Checked 2026-11-20.
- MarTech Zone, B2B marketing metrics (funnel-stage metrics; CAC definition). Checked 2026-11-20.
Was this article helpful?
We use your answers to fix and expand this page.
Couldn’t send. Please try again in a minute.
Thanks for the feedback. We’ll use it to improve this page.You’ve already sent feedback on this page. Thanks.

Data Engineer
Writes about event design, data quality, and collection workflows, with verifiable implementation methods for reliable analytics.