Try it on your own data
Every report in this article is in the free plan. One snippet for web and apps, up to 10 sites.
Start freeB2B marketing attribution assigns credit for a deal to the touchpoints that influenced it, and it must be counted at the account level — not the person level — because one deal spans several people, channels and months. Below: a reproducible five-model example, window truncation, model choice and the analytics–CRM split.
What you will learn
- Count credit at the account level: one deal spans several people, channels and months, so person-level reports hide most of the journey.
- Read several models side by side — linear and position reveal the assist-only channels that first- and last-click zero out.
- Set the lookback window to the sales cycle (up to 90 days), and keep deal amounts in the CRM; analytics supplies the credit percentages.
What is B2B marketing attribution?
B2B marketing attribution assigns credit for a closed deal to the marketing touchpoints that influenced it. A touchpoint is a session before the conversion — a blog read, a pricing visit, an email click — not an ad click matched to an app install. The general mechanics of splitting credit across touches are covered in multi-touch attribution, and the term itself is in the attribution glossary. This article is about the part that makes B2B different: the unit of credit is the account, not the individual visitor.
Three structural differences drive everything below. The cycle is long and mostly self-serve: Gartner's 2023 survey of 771 B2B buyers in the US, Canada, UK and Australia found that 75% prefer a rep-free buying experience, so most of the journey happens on your site and in email before sales talks to anyone. The decision is collective: a buying committee, not one person. And many touches are offline or untrackable. Lemon and Verhoef's 2016 customer-journey framework sorts touches into brand-owned, partner-owned, customer-owned and social/external — a reminder that you directly control only some of them.
The table contrasts the two settings; the rest of the article works through the B2B column with a reproducible example.
| Dimension | B2C | B2B |
|---|---|---|
| Sales cycle | Minutes to days | Weeks to months (88 days in the example) |
| Decision unit | One person | A buying committee (4 people in the example) |
| People involved | Usually 1 | Several roles: researcher, evaluator, lead, decision-maker |
| Offline touches | Rare | Common: demos, calls, events, partner referrals |
| Unit of credit | The visitor / session | The account, rolled up from member sessions |
Count credit at the account level: one deal spans several people, channels and months.
Why person-level credit breaks on a buying committee
Take a fictional account, Acme Corp (sample data). Four people research and decide over 88 days, producing nine sessions before one demo request. Ana is the researcher, Ben does the technical evaluation, Cara leads the team, and Dana is the VP who signs. The conversion is Dana's demo request on day 0.
| # | Days before conversion | Person | Channel | Page |
|---|---|---|---|---|
| 1 | −88 | Ana (researcher) | Organic search | Blog post |
| 2 | −75 | Ana (researcher) | Organic social | LinkedIn post → webinar signup |
| 3 | −61 | Ben (technical evaluator) | Paid search | Pricing page |
| 4 | −47 | Ben (technical evaluator) | Case study | |
| 5 | −33 | Cara (team lead) | Organic search | Comparison page |
| 6 | −20 | Cara (team lead) | ROI guide | |
| 7 | −10 | Dana (VP, decision-maker) | Referral | Partner review site → landing page |
| 8 | −4 | Dana (VP, decision-maker) | Organic social | LinkedIn post → demo page |
| 9 | 0 | Dana (VP, decision-maker) | Direct | Demo request (converting session) |
Now run attribution the way a person-level report does: filter to Dana, the contact who converted. You see three of the nine sessions — the referral visit, the LinkedIn visit and the direct demo request. Ana's two sessions, Ben's two and Cara's two are invisible because they belong to other people. Under last click, Direct takes all the credit, and the channels that started and nurtured the deal disappear from the report. Two of the four people never appear at all.
That is the problem this article solves: B2B credit has to be counted at the account level. Roll the four people's sessions into one account path and all nine touches — six channels — become visible. Grouping people into accounts and measuring account engagement is covered in account-based marketing analytics.
Five models on one account: the worked example
With the nine sessions treated as one account path, here is what each model gives each channel. First and last are single-touch; linear, position and time decay are multi-touch. The linear and last-click glossary entries define the two extremes, and position-based attribution explains the 40/20/40 split.
| Channel | First | Last | Linear | Position (40/20/40) | Time decay (half-life 7d) |
|---|---|---|---|---|---|
| Organic search | 100% | 0% | 22.22% | 42.86% | 1.71% |
| Organic social | 0% | 0% | 22.22% | 5.71% | 30.16% |
| Paid search | 0% | 0% | 11.11% | 2.86% | 0.11% |
| 0% | 0% | 22.22% | 5.71% | 6.61% | |
| Referral | 0% | 0% | 11.11% | 2.86% | 16.64% |
| Direct | 0% | 100% | 11.11% | 40% | 44.78% |
Sample data. Each column sums to 100%; the printed two-decimal figures may differ by 0.01 from rounding.
The arithmetic, so you can recompute it:
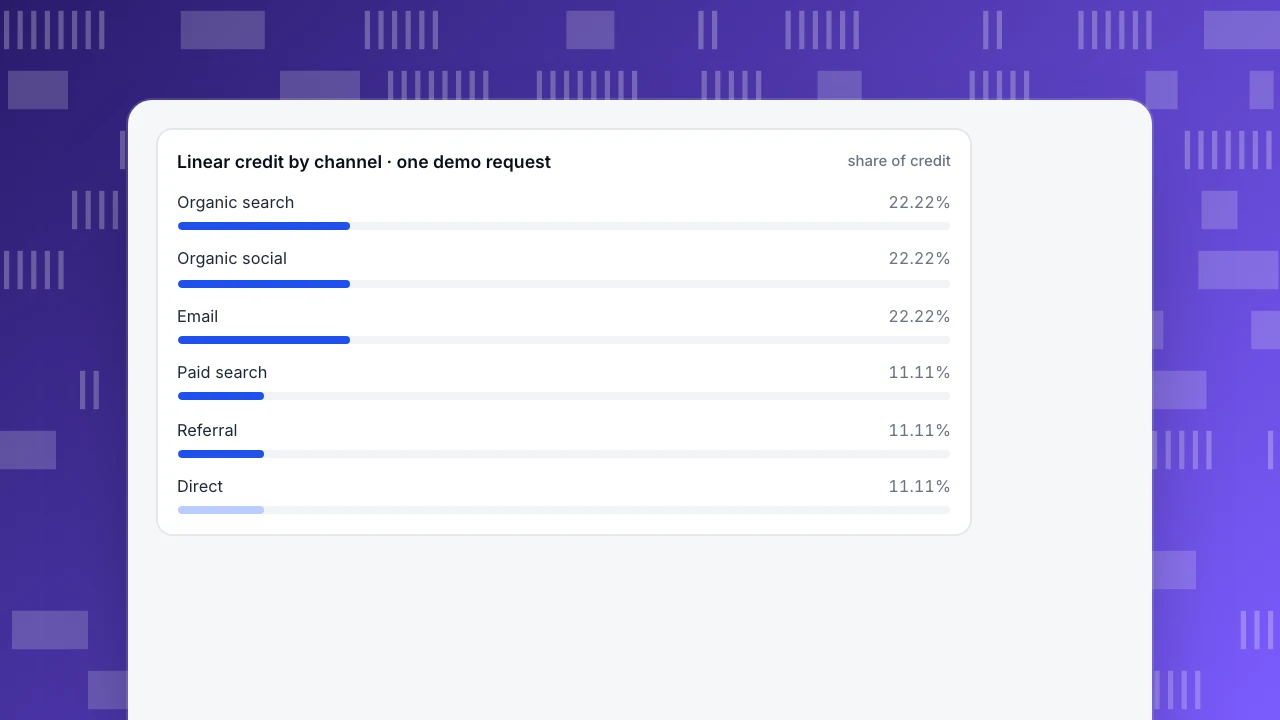
- Linear. Each of the nine sessions gets 1 ÷ 9 = 11.11%. Organic search, organic social and email each appear twice, so each gets 22.22%; paid search, referral and direct appear once, so 11.11% each.
- Position (40/20/40). The first touch (organic search) gets 40%, the last (direct) gets 40%, and the seven middle touches split 20%, so 20 ÷ 7 ≈ 2.86% each. Organic search also has one middle touch: 40 + 2.86 = 42.86%. Organic social and email each have two middle touches: 5.71%.
- Time decay (half-life 7 days). Each touch gets weight w = 2^(−d/7), where d is days before conversion. The nine weights sum to 2.2332; divide each weight by that sum. The converting session (d = 0) gets 1 ÷ 2.2332 = 44.78%, the LinkedIn visit four days earlier gets 30.16%, the referral ten days earlier 16.64%, and everything older shrinks toward zero.
The point is the four assist-only channels — organic social, paid search, email and referral — that never appear as a first or last touch. First and last click give them zero. Linear gives each real credit; position and time decay give them smaller but non-zero shares. Read only the last-click column and you would defund the four channels that did most of the nurturing. The chart shows the linear split; under last click, Direct alone would fill the bar.
The spread between columns is itself the finding. Organic search ranges from 100% (first) to 1.71% (time decay); direct ranges from 0% (first) to 100% (last). No single number is the truth about a channel — each answers a different question. That is why the five columns sit side by side rather than one replacing the others, and why a budget decision should cite at least two of them.
Linear credit by channel · one demo request
share of creditWhat the lookback window cuts off
The lookback window decides which sessions count. TapCub's default is 30 days (configurable 1–90), and it includes the converting session. On Acme's 88-day journey the default window is a truncation, not a setting you can ignore.
Keep only sessions within 30 days of conversion and four of the nine survive: email at −20, referral at −10, organic social at −4 and direct at 0. Five sessions are cut — all of Ana's and Ben's, plus Cara's comparison-page visit. The consequences are concrete:
- First-touch credit moves from organic search to email, because email is now the earliest surviving touch.
- Organic search and paid search drop to zero in every model; they fall outside the window entirely.
- Linear now splits 25% across four channels instead of 11.11% across nine sessions.
The same account looks like a four-channel, email-led deal at 30 days and a six-channel, search-led deal at 90 days. The rule: set the window to cover your typical sales cycle. At 90 days all nine Acme sessions survive (the earliest is −88). If your cycle runs longer than 90 days — say a first visit at −120 — those early touches cannot enter the model at any setting. Do not force them in; capture them as self-reported source ("where did you hear about us?") or a CRM note, and treat them as qualitative context rather than model credit.
At 90 days the single-touch picture also settles: first click stays with organic search and last click stays with direct, because both endpoints survive, and position keeps its 40/20/40 shape across all nine touches. Widening the window does not just add sessions — it restores the opening and closing touches the 30-day default hid, which is exactly the credit a long B2B cycle needs to see.
Choosing a model by the question you need answered
No model is "correct"; each answers a different question. Pick by the decision you are making, and read more than one column before moving budget. The compare attribution models help page walks the side-by-side view.
| Question you need answered | Model | Pitfall |
|---|---|---|
| Which channels participated at all? | Linear | Treats a casual blog read equal to the converting demo |
| Who opened and who closed the deal? | Position (40/20/40) | Under-credits the middle nurturing touches |
| What is driving recent conversions? | Time decay (7d half-life) | Under-credits early research on long cycles |
| Who gets the final nudge? | Last click | Zeros every assist-only channel |
| What started the journey? | First click | Ignores everything that nurtured the deal |
Two if-then rules. If you are deciding which channels to keep funding, read linear and position together: linear shows who participated, position shows who opened and closed. If you are judging recent campaign momentum, time decay weights the touches near conversion — but it under-credits the early research that started a long deal.
One platform note, with the official source: Google retired the rules-based models — first click, linear, time decay and position-based — from Google Ads and GA4 in 2023, made data-driven the default, and left last click available (Google Ads announcement). GA4's current attribution settings are documented in Get started with attribution. The takeaway is not "copy GA4"; it is that a single default column is a choice, and you should know which question it answers before you act on it.
A note on data-driven models: they learn credit from your own conversion paths, which needs volume. B2B sites often have too few conversions per month for a stable learned model, so the rules-based models above remain the practical choice — transparent and reproducible on a single account, as the Acme table shows. If you do have the volume, treat a data-driven column as one more view to compare, not a replacement for judgement.
Offline and dark-funnel touches
Some touches never reach your analytics: a podcast mention, a Slack recommendation, a conference hallway conversation. These are the dark funnel. You cannot recover them all, but a three-step rule captures the ones that matter:
- Ask at the moments that convert. On the demo form or in the first chat, ask "Where did you hear about us?" and record the answer as an event or a CRM field. Self-reported source is the only way to credit a touch you never tracked.
- Keep UTM discipline. Tag every link you control — email, social, partner placements — with consistent utm_source, utm_medium and utm_campaign, so the touches you can track land in the right channel instead of falling into direct.
- Log offline events. Import trade-show scans, webinar attendance and sales-call outcomes as events tied to the person, so they join the account path. Lemon and Verhoef's touchpoint categories are a useful checklist: brand-owned touches you can tag, partner-owned touches you can ask about, customer-owned and social touches you mostly capture by asking.
Be honest about the limit: a private recommendation you never hear about stays uncredited. Self-reported source recovers some of it, with recall bias. Treat dark-funnel credit as directional, not exact.
Analytics vs CRM: who owns which number
Attribution percentages and deal amounts live in different systems, and mixing them is where B2B reporting breaks. Analytics owns the journey; the CRM owns the money.
| Number | Owner | Why |
|---|---|---|
| Sessions, paths, touchpoints | Analytics | Observed before conversion |
| Model credit percentages | Analytics | Computed from the account path |
| Goal conversions (demo requests) | Analytics | Defined as an event or page |
| Opportunity stage | CRM | Sales judgement, not a web event |
| Deal amount and close date | CRM | Commercial record; not stored in analytics |
The handoff is three steps. First, define the conversion in analytics (the demo request) and the deal stages in the CRM. Second, combine the members' paths into one account path and compute the model credit on it. Third, multiply those percentages by the CRM's closed-won amount in a spreadsheet. TapCub does not store opportunity or deal amounts — that mapping happens outside it.
Sample data: Acme's deal closes at $60,000 (from the CRM). Applying the linear shares, organic search, organic social and email each get 2/9 × $60,000 = $13,333.33, while paid search, referral and direct each get 1/9 × $60,000 = $6,666.67. The total is 3 × $13,333.33 + 3 × $6,666.67 = $60,000. The percentages come from analytics, the $60,000 comes from the CRM, and neither system holds both.
Agree the handoff fields once and write them down: the account identifier, the converting contact, the conversion date, the model used, the lookback window, and the credit percentages. With those fixed, marketing and sales reconcile the same deal the same way every month, instead of arguing over whose number is right.
Common B2B attribution mistakes
Four mistakes, each corrected with a number from the Acme example:
- Reading only last click. Last click gives Direct 100% and zeros the four assist-only channels. Fix: read linear and position alongside it; organic social, paid search, email and referral all earn credit there.
- Leaving the default 30-day window on a long cycle. At 30 days, five of Acme's nine sessions vanish and organic search and paid search drop to zero. Fix: set the window to the cycle length, up to 90 days.
- Counting anonymous and bot traffic in the denominator. Unidentified visitors cannot be tied to an account, and bots inflate session counts. Fix: identify logged-in people, group them into accounts, and keep bot traffic separate so it does not dilute conversion rates.
- Moving budget on one column. Time decay gives Direct 44.78% and organic search just 1.71%, while linear gives organic search 22.22%. Fix: never reallocate on a single model; compare columns and validate against closed-won deals in the CRM.
How to run this example in TapCub
The same Acme demo request, walked through TapCub. TapCub's attribution report scores each converting person's own sessions, so it shows you the person-level view first; the account rollup is the step you add. TapCub measures the journey; it is not a CRM, and the deal amount stays in yours.
- Identify and group the people. After each member logs in, call
tapcub.login, thentapcub.group('company', 'acme', {...})to put them in one account; a person can belong to several accounts. Anonymous visitors never become account members, so the four people must be identified. See analyze accounts with groups. - Read the account and its health score. All-platform analytics › Users › Accounts shows account count, accounts active in 30 days, members and a 0–100 health score; open Acme to see its members and 30-day activity. For Acme: 40 × (3/4 active members) + 30 × (12/30 active days) + 30 (seen in the last 7 days) = 72/100 — an engaged account worth a sales conversation.
- Score the demo request side by side. In All-platform analytics › Behavior › Behavior analysis, choose attribution, set the demo request as the goal, set the lookback to 90 days (default 30, range 1–90, including the converting session) and select all five models; each becomes a column. Identity defaults to person, so Dana's request is credited across her own three sessions: referral first, direct last, 33.33% each under linear, 40/20/40 under position, and about 18.17% / 32.92% / 48.91% under time decay. That is exactly the person-level blind spot from the section above. See compare attribution models.
- Roll the members up into the account path. Open each member from the Acme account in All-platform analytics › Users › People; the day-by-day timeline lists their visits. Combining Ana's, Ben's, Cara's and Dana's sessions gives the nine-touch path, and the five-model table above is that rollup done by hand — TapCub has no account-level attribution report.
- Add spend, then hand off. Import spend in All-platform analytics › Business › Channel ROI (CSV or one row at a time, by day, channel, source and campaign) to read cost per click (spend ÷ sessions) by channel. Its cost per acquisition counts purchases on the order ledger, so a demo-request funnel without orders leaves it blank. Opportunity stage, amount and close date stay in the CRM; multiply the model percentages by the CRM amount in a spreadsheet, as in the $60,000 mapping above.
Boundaries worth stating plainly: the lookback caps at 90 days, so cycles longer than that need self-reported source or CRM notes for the early touches; attribution credits pre-conversion sessions, not click-to-install matching; TapCub does no CRM, opportunity management or lead scoring; anonymous visitors never join accounts; and bots are counted separately from real people, so crawlers do not inflate session counts.
FAQ
What is B2B marketing attribution?
B2B marketing attribution assigns credit for a closed deal to the marketing touchpoints that influenced it. Because a B2B deal involves a buying committee over weeks or months, credit is counted at the account level — rolling every member's sessions into one path — rather than at the individual visitor level, which hides most of the journey.
Which attribution model fits B2B?
No single model fits every question. Linear shows which channels participated; position (40/20/40) emphasises the touches that opened and closed the deal; time decay weights recent touches. Read several columns side by side and validate against closed-won deals before moving budget. First and last click alone zero out the assist-only channels that nurture long B2B deals.
Why is B2B attribution so difficult?
Three reasons: long sales cycles that outlast short lookback windows, buying committees whose members each touch different channels, and offline or dark-funnel touches you never track. In the Acme example a 30-day window cuts five of nine sessions, and a person-level report sees only three of nine. Account-level grouping and a 90-day window fix most of it.
How do you measure B2B marketing attribution?
Identify logged-in people and group them into accounts, define the conversion, set the lookback window to the sales cycle, and read several attribution models side by side. Then combine the members' paths into one account path, compute the credit percentages and multiply them by the CRM's closed-won amount in a spreadsheet. Analytics supplies the percentages; the CRM supplies the money.
How long should the attribution window be for long sales cycles?
Set it to cover your typical cycle, up to the 90-day maximum. At 90 days all nine Acme sessions survive; at the 30-day default only four do, and first-touch credit shifts from organic search to email. If your cycle exceeds 90 days, capture early touches as self-reported source or CRM notes rather than forcing them into the model.
Sources
- Google. Get started with attribution. GA4 Help — reporting attribution model, eligible channels and key-event lookback window. Verified 2026-11-15.
- Google. About the migration to data-driven attribution. Google Ads Help, 2023-04-06 — first click, linear, time decay and position-based retired; last click unaffected. Verified 2026-11-15.
- Lemon, K. N. & Verhoef, P. C. (2016). Understanding Customer Experience Throughout the Customer Journey. Journal of Marketing 80(6):69–96 — customer-journey touchpoint categories. Verified 2026-11-15.
- Gartner (2023). How to Adapt Sales Strategies to the Current State of B2B Buying. Survey of 771 B2B buyers — 75% prefer a rep-free buying experience. Verified 2026-11-15.
Was this article helpful?
We use your answers to fix and expand this page.
Couldn’t send. Please try again in a minute.
Thanks for the feedback. We’ll use it to improve this page.You’ve already sent feedback on this page. Thanks.

Product Analyst
Focuses on event analysis, conversion funnels, and retention, using clear metric definitions and structured analysis to explain product performance.