Try it on your own data
Every report in this article is in the free plan. One snippet for web and apps, up to 10 sites.
Start freeA good B2B conversion rate is usually 1% to 3% of sessions when a conversion is a qualified lead, but the right figure depends on your channel mix. Ruler Analytics' 2025 B2B rates range from 0.3% for social in tech to 3.9% for referral in B2B eCommerce. Below: the benchmarks, how to compute your mix-weighted expected rate and when a gap is real.
What you will learn
- Compare with a mix-weighted expected rate, not one average: the same channel results give 1.96% or 1.41% depending on how much traffic is social
- In the worked site, organic search explains 26 of 38 missing leads, so one channel ratio beats a vague blended gap
- Below roughly 5,000 sessions a channel rate is too noisy to judge a 0.5-point gap against any benchmark
What is a good B2B conversion rate?
A good B2B website conversion rate is usually in the low single digits when a conversion means a qualified lead from a visitor session. Ruler Analytics, which tracks conversions as qualified leads or sales captured by form or phone, prints 2025 full-year channel rates between 0.3% and 3.9% for B2B segments. First Page Sage, an agency reporting its own client data, lists visitor-to-lead rates of 0.7% to 2.3% depending on company size. Neither is a single average, and a number you read elsewhere may be defined differently.
Three definitions explain most of the confusion:
- Conversion to what? In B2B a conversion is normally a form submission, demo request or call, not a purchase. Ruler counts a qualified lead or sale, which is stricter than "any form fill".
- Per what? Rates per session, per visitor and per landing page give different answers for the same traffic.
- Across what traffic? A blended rate depends on how much of your traffic comes from channels that convert well.
The sections below give the published channel rates, show how traffic mix moves a blended rate with a worked example, and set out how to read the rest of the funnel after the lead. If you already know your visitor-to-lead rate and want to work out lead-to-customer, see lead conversion rate; for the wider set of B2B site metrics see B2B website metrics.
What are B2B conversion rates by channel?
Ruler Analytics publishes its 2025 full-year conversion rates by channel for three B2B segments. A conversion is a qualified lead or sale captured by form submission or phone call, and the rate is conversions divided by sessions.
| Channel | B2B eCommerce | B2B services | B2B tech |
|---|---|---|---|
| Direct | 2.1% | 2.7% | 1.5% |
| 2.5% | 2.2% | 2.5% | |
| Organic search | 1.5% | 2.3% | 2.5% |
| Paid search | 1.7% | 3.4% | 1.5% |
| Referral | 3.9% | 1.6% | 1.9% |
| Social media | 0.4% | 2.4% | 0.3% |
Three patterns stand out. Social media is the weakest channel for B2B eCommerce and B2B tech (0.4% and 0.3%) but not for B2B services (2.4%). Referral is the strongest channel for B2B eCommerce at 3.9% and weak for services at 1.6%. Paid search leads services at 3.4% but sits at 1.5% for B2B tech, tied with direct and above only social. The ranking of channels depends on the segment, so a benchmark that ignores the segment will mislead you.
A different kind of figure is useful as a ceiling. Unbounce reports a median conversion rate of about 6.6% across all industries for Q4 2024, from 41,000 landing pages, 464 million visitors and 57 million conversions (page updated 2025-03-04). That is a landing-page rate, not a site rate, and it covers every industry, not just B2B, so it describes pages built to convert one offer. Do not compare it with a whole-site rate.
| Channel | B2B eCommerce | B2B services | B2B tech |
|---|---|---|---|
| Direct | 2.1% | 2.7% | 1.5% |
| 2.5% | 2.2% | 2.5% | |
| Organic search | 1.5% | 2.3% | 2.5% |
| Paid search | 1.7% | 3.4% | 1.5% |
| Referral | 3.9% | 1.6% | 1.9% |
| Social media | 0.4% | 2.4% | 0.3% |
Ruler Analytics, 2025 full year; a conversion is a qualified lead or sale captured by form or call, rate = conversions ÷ sessions.
Why does my blended B2B conversion rate differ from the benchmark?
Because the blend is a weighted average. The expected blended rate for your site is the sum, over channels, of each channel's share of sessions times that channel's benchmark rate. If your traffic mix differs from the sample behind the benchmark, your blended rate will differ even if every channel performs exactly at the benchmark.
Sample data, using Ruler's B2B tech rates (organic 2.5%, direct 1.5%, paid 1.5%, email 2.5%, social 0.3%, referral 1.9%):
- Mix A: 40% organic, 25% direct, 15% paid, 10% email, 5% social, 5% referral. Expected blended rate = 0.40 × 2.5 + 0.25 × 1.5 + 0.15 × 1.5 + 0.10 × 2.5 + 0.05 × 0.3 + 0.05 × 1.9 = 1.96%, so 196 leads from 10,000 sessions.
- Mix B: 20% organic, 20% direct, 20% paid, 5% email, 30% social, 5% referral. Expected blended rate = 1.41%, so 141 leads from 10,000 sessions.
Same channel performance, 28% fewer leads, only because social grew from 5% to 30% of sessions. A blended number alone cannot tell you whether the site got worse or the traffic changed. The check is to compute the expected number for your own mix.
Now the self-check. Sample data: a site gets 8,200 sessions and 123 qualified leads in a quarter, a blended 1.5%. Its channel split follows Mix A. Expected leads per channel are sessions × the B2B tech rate:
| Channel | Sessions | Expected leads | Actual leads | Actual rate | Actual ÷ expected |
|---|---|---|---|---|---|
| Organic | 3,280 | 82.0 | 56 | 1.71% | 0.68 |
| Direct | 2,050 | 30.8 | 27 | 1.32% | 0.88 |
| Paid | 1,230 | 18.5 | 15 | 1.22% | 0.81 |
| 820 | 20.5 | 14 | 1.71% | 0.68 | |
| Social | 410 | 1.2 | 3 | 0.73% | 2.44 |
| Referral | 410 | 7.8 | 8 | 1.95% | 1.03 |
| Total | 8,200 | 160.7 | 123 | 1.50% | 0.77 |
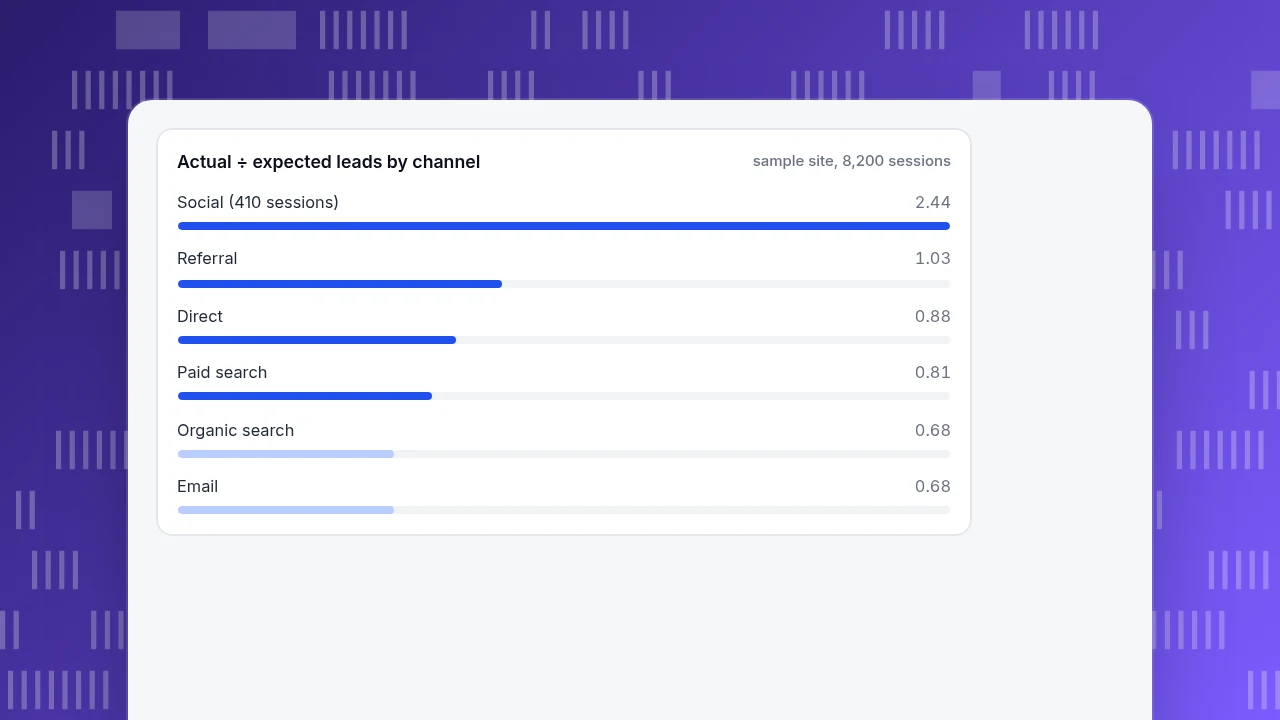
The site produces 77% of the leads its mix predicts, a gap of about 38 leads. Organic search accounts for 26 of them (82.0 expected against 56), so that is where to look first. The blended 1.5% against a 1.96% mix-weighted expectation says something precise; "1.5% against a generic 2–3%" does not.
Actual ÷ expected leads by channel
sample site, 8,200 sessionsHow do rates change after the lead?
The first conversion is only the start of a B2B funnel. First Page Sage's company-size table gives the later stage rates, which multiply into a lead-to-customer rate:
| Company size | Lead to MQL | MQL to SQL | SQL to opportunity | Opportunity to close | Lead to customer |
|---|---|---|---|---|---|
| $1–10M | 37% | 32% | 40% | 46% | 2.18% |
| $10–100M | 41% | 39% | 42% | 39% | 2.62% |
| $100M–1B | 40% | 39% | 46% | 35% | 2.51% |
| $1B+ | 34% | 40% | 36% | 31% | 1.52% |
For the $10–100M row: 0.41 × 0.39 × 0.42 × 0.39 = 2.62%. Of 100 leads, about 2.6 become customers. So the 123 leads in the example above would produce roughly 3.2 customers in that segment (123 × 2.62%). The practical consequence is that a 10% improvement in visitor-to-lead rate and a 10% improvement in any later stage change customers by the same 10%, but the later improvement is usually harder and slower to win. First Page Sage defines a lead as a non-spam visitor who submitted contact information and says its data comes from 50+ B2B SaaS clients, mostly small to midsize, so treat these as a published range rather than a market average.
How many sessions do I need before a benchmark gap means anything?
Fewer than you might think for a large gap, and many more than you have for a small one. The standard error of a rate p measured on n sessions is the square root of p × (1 − p) ÷ n, and a rough 95% interval is plus or minus 1.96 times that.
Sample data at a true rate of 2.0%:
| Sessions | Conversions expected | 95% interval for the measured rate |
|---|---|---|
| 250 | 5 | 0.26% to 3.74% |
| 1,000 | 20 | 1.13% to 2.87% |
| 5,000 | 100 | 1.61% to 2.39% |
| 20,000 | 400 | 1.81% to 2.19% |
At 1,000 sessions a measured 1.5% and a measured 2.5% are statistically indistinguishable from the same 2.0% site. The rule that follows: judge a channel against its benchmark only when it has enough sessions for the interval to be narrower than the gap you care about. For the small channels in the table above, such as social at 410 sessions, treat the ratio as noise.
How do I track B2B conversion in TapCub?
Take the sample site above: 8,200 sessions, 123 qualified leads and a suspicion that organic search is the problem. TapCub measures the website part of that story and leaves the sales stages to your CRM.
- Define one lead event. In Web analytics › Goals, set the goal to the action you count as a qualified lead: a thank-you page, a demo request event or a form submission. Form submission tracking is off by default; switching on
data-forms="true"records the form's id, name and action, never what the visitor typed. The same goals appear in All-platform analytics › Business › Goals. - Read conversions by channel. Web analytics › Sources shows visitors, sessions and conversions by channel, referrer and UTM. Multiply each channel's sessions by the benchmark rate above to get the expected column of the table, then compare it with the actual conversions.
- Keep bots out of the denominator. Bots and AI crawlers are counted separately in Web analytics › Bots, so they do not inflate sessions and pull the rate down.
- Drill into the lagging channel. Click the organic row to filter the other reports by it, then look at Web analytics › Pages for the landing pages that bring organic sessions but few conversions.
- Take the later stages from your CRM. MQL, SQL, opportunity and close are CRM counts; TapCub is not a CRM and does no lead scoring. Divide the CRM customer count by TapCub's lead count to get your lead-to-customer rate and compare it with the table above.
FAQ
What is the average B2B conversion rate?
There is no single average. Published website figures for qualified leads sit between 0.3% and 3.9% by channel and segment (Ruler Analytics, 2025), and visitor-to-lead rates of 0.7% to 2.3% by company size (First Page Sage). The right comparison is your own channel mix and definition.
Is a 2% conversion rate good for B2B?
Often yes, if it measures qualified leads per session across a normal channel mix. Using Ruler's B2B tech rates, the sample Mix A above has a mix-weighted expectation of 1.96%. Check your own mix: a site heavy on social traffic would be at its benchmark with a figure well below 2%.
Why are landing page conversion rates higher than site rates?
A landing page is built around one offer and receives targeted traffic, while a site rate includes every session on every page. Unbounce's median of about 6.6% is a landing-page figure across all industries. Compare page rates only with page rates.
How many conversions do I need before comparing with a benchmark?
Enough that the 95% interval is narrower than the gap you care about. At a true 2.0%, 1,000 sessions give an interval of 1.13% to 2.87%, which is too wide to separate 1.5% from 2.5%. At 20,000 sessions the interval narrows to 1.81% to 2.19%.
Sources
- Ruler Analytics. Conversion rate benchmarks — 2025 full-year channel rates for B2B eCommerce, services and tech, and the definition of a conversion; published 2026-11-13. Checked 2026-11-20 (the site blocks some automated requests; opens in a browser).
- Unbounce. Average conversion rates for landing pages — Q4 2024 median across industries from 41,000 landing pages; updated 2025-03-04. Checked 2026-11-20 (the site blocks some automated requests; opens in a browser).
- First Page Sage. B2B SaaS funnel conversion benchmarks — stage rates by company size and the lead definition; updated 2025-06-11. Checked 2026-11-20.
Was this article helpful?
We use your answers to fix and expand this page.
Couldn’t send. Please try again in a minute.
Thanks for the feedback. We’ll use it to improve this page.You’ve already sent feedback on this page. Thanks.

Product Analyst
Focuses on event analysis, conversion funnels, and retention, using clear metric definitions and structured analysis to explain product performance.