Try it on your own data
Every report in this article is in the free plan. One snippet for web and apps, up to 10 sites.
Start freeThe average SaaS churn rate has no single value: published figures differ by basis (customers or revenue), window (month or year), contract size and percentile. In ChartMogul's data, top-quartile annual logo churn runs from 36.9% for accounts under $10 a month to 14.3% above $500 a month. Below: the benchmark table, period conversion and a self-check example.
What you will learn
- Compare only with a benchmark that shares your basis, window, contract size and percentile
- Annual churn is 1 − (1 − monthly)^12, not 12 × monthly; 5% a month is 46.0% a year
- Use the starting-cohort method: one sample company gets 14.0%, 19.4% or 23.0% depending on the denominator
What is the average SaaS churn rate?
There is no single average, and the published figures disagree for a reason worth knowing before you compare anything: they measure different things. Some count customers, some count revenue, some use a monthly window and some a twelve-month one, and they sample different kinds of companies. The table below lists what three public sources actually print, with what each one measures.
| Source (date) | What it measures | Figure printed |
|---|---|---|
| Recurly churn benchmarks (July 2026 network data) | Subscriber churn, median, SaaS industry row | 3.22% total, of which 2.16% voluntary and 1.06% involuntary |
| ChartMogul SaaS Retention Report (Nov 2023, 2,100+ SaaS companies, 2022 data) | Customer (logo) retention over 12 months, top quartile | 63.1% for ARPA under $10 a month, 85.7% for ARPA over $500 a month |
| SaaS Capital retention benchmarks (Sept 2025, Dec 2023 vs Dec 2024 MRR) | Net revenue retention, median, $25,000–$50,000 ACV | 102% (top quartile 111%, bottom quartile 97%) |
Read the middle row carefully: it is the top quartile, the best-performing quarter of companies, not the median. A top-quartile 85.7% retention means a 14.3% annual logo churn for the best quarter of high-ARPA companies. If you hold that number up against your own churn and call yourself average, you have compared yourself with the wrong group.
Two things follow. First, "average SaaS churn" is only meaningful with four labels attached: customer or revenue, which window, which contract size and which percentile. Second, the most useful benchmark is one you can reproduce from your own data with the same definition, which is what the rest of this guide sets up. How to compute the rate itself is in how to calculate churn rate, and how it relates to retention in churn rate vs retention rate.
| Source | What it measures | Figure printed |
|---|---|---|
| Recurly (July 2026 data) | Median subscriber churn, SaaS row | 3.22% total (2.16% voluntary, 1.06% involuntary) |
| ChartMogul (2023, 2,100+ companies) | Top-quartile 12-month logo retention | 63.1% (ARPA under $10/month) to 85.7% (over $500/month) |
| SaaS Capital (Sept 2025) | Median NRR, $25,000–$50,000 ACV | 102% (top quartile 111%, bottom 97%) |
Each source measures a different population and period; none is the 'average SaaS churn rate' on its own.
How does churn change with contract size?
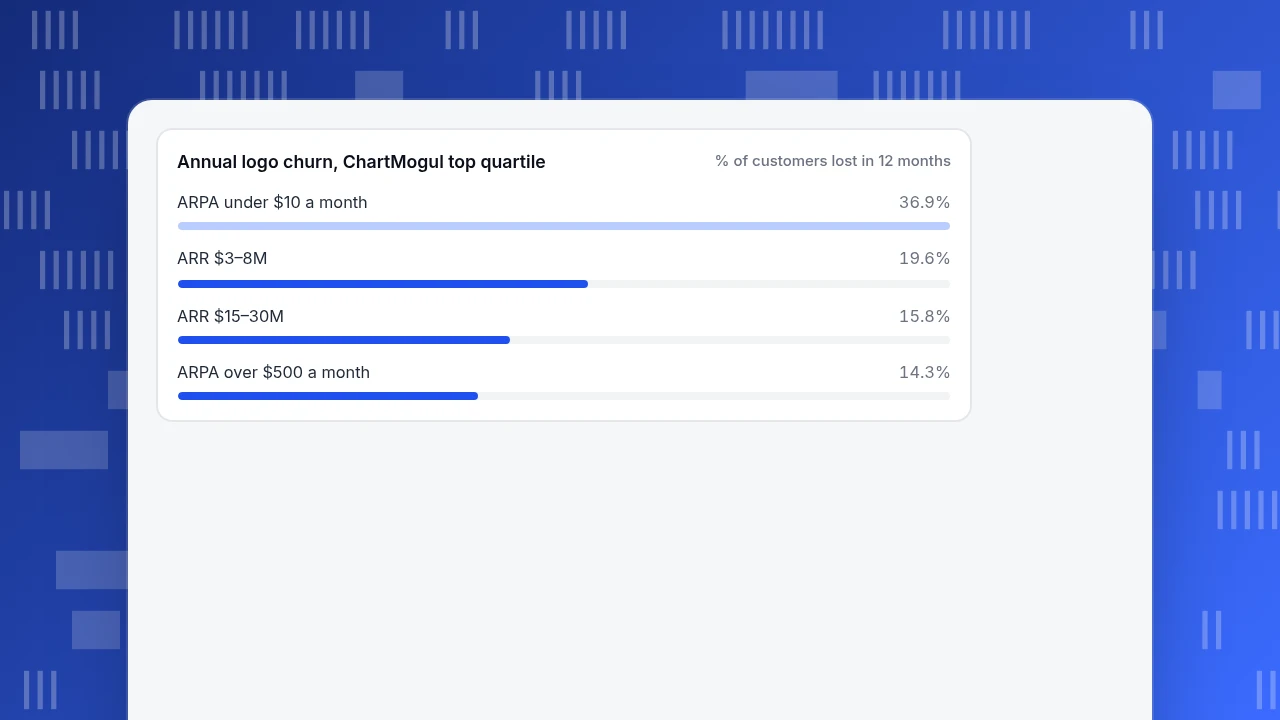
Churn falls as price rises, and the ChartMogul report shows it clearly. Its ARPA (average revenue per account) bands translate into annual contract value by multiplying by twelve; the report itself equates $500 a month to an ACV of $6,000. The table converts each printed top-quartile retention figure into annual churn and into the monthly rate that would compound to it (the formula is in the next section).
| Segment (ChartMogul, top quartile) | Customer retention, 12 months | Annual logo churn | Equivalent monthly churn |
|---|---|---|---|
| ARPA under $10 a month (ACV under $120) | 63.1% | 36.9% | 3.76% |
| ARR $3–8M | 80.4% | 19.6% | 1.80% |
| ARR $15–30M | 84.2% | 15.8% | 1.42% |
| ARPA over $500 a month (ACV over $6,000) | 85.7% | 14.3% | 1.28% |
The gap between the first and last row is a factor of 2.6 in annual churn (36.9 ÷ 14.3) and 2.9 in the monthly equivalent (3.76 ÷ 1.28), both computed from the printed retention values. The same report prints gross revenue retention for the top quartile at 90% or more for ARPA over $500 a month and 60–70% for ARPA under $50 a month.
Recurly's ARPC (average revenue per customer) table points the same way. Its median total churn is 4.29% for $10–$25, 3.84% for $25–$50, 3.15% for $50–$100 and 2.87% for $100–$250. It is not perfectly monotonic: the over-$250 row prints 3.07% in the chart (and a different figure in the text), a reminder that benchmark pages contain transcription noise and should be checked against the original.
The practical rule: pick the band by your ARPA or ACV first, company size second, and treat an industry label as the weakest filter. A $15 a month self-serve product and a $50,000 a year platform share a category but not a churn profile.
Annual logo churn, ChartMogul top quartile
% of customers lost in 12 monthsHow do I convert monthly churn to annual churn, and back?
Churn compounds, so annual churn is not twelve times monthly churn. If a fraction m of customers leave each month, the share still present after twelve months is (1 − m)^12, so:
- annual churn = 1 − (1 − m)^12
- monthly churn = 1 − (1 − a)^(1/12), where a is annual churn
Sample values, computed with these formulas:
| Monthly churn | Annual churn | Annual churn if you wrongly multiply by 12 |
|---|---|---|
| 0.5% | 5.8% | 6.0% |
| 1% | 11.4% | 12% |
| 2% | 21.5% | 24% |
| 3% | 30.6% | 36% |
| 5% | 46.0% | 60% |
The multiply-by-12 shortcut overstates the annual figure by 0.2 points at 0.5% monthly and by 14 points at 5% monthly.
This conversion is also the quickest way to test whether a benchmark is plausible. Recurly's SaaS row of 3.22% is printed on a table the page labels as median annual rates, and its headline averages carry no stated period. Read as a monthly rate, 3.22% would be 32.5% a year; read as annual, it is only 0.27% a month. ChartMogul's top-quartile logo retention of 80–86% (14–20% annual churn) sits between those readings, at 1.3–1.8% a month. The sources are measuring different populations and periods, so none of them is "wrong", but you cannot put your own monthly figure beside a number whose period is not printed. If a page does not say, treat the number as unusable for comparison.
What about revenue churn, GRR and NRR?
Customer churn counts heads. For a business with different plan sizes it can mislead, so most benchmarks also publish revenue measures:
- Gross revenue retention (GRR) = (starting MRR − churned MRR − contraction MRR) ÷ starting MRR. It cannot exceed 100%. See gross revenue retention.
- Net revenue retention (NRR) = (starting MRR − churned − contraction + expansion) ÷ starting MRR. It can exceed 100%. See net revenue retention.
- Revenue churn is the loss side of the same arithmetic, gross or net. See revenue churn.
Sample data: a company starts the year with $100,000 of MRR from the same customers. Over the year $8,000 cancels, $3,000 downgrades and $6,000 upgrades.
- GRR = (100,000 − 8,000 − 3,000) ÷ 100,000 = 89%
- NRR = (100,000 − 8,000 − 3,000 + 6,000) ÷ 100,000 = 95%
- Gross revenue churn = (8,000 + 3,000) ÷ 100,000 = 11%; net revenue churn = (8,000 + 3,000 − 6,000) ÷ 100,000 = 5%
NRR of 95% sounds mild. Set against SaaS Capital's median NRR of 102% for the $25,000–$50,000 ACV band (top quartile 111%, bottom quartile 97%), 95% is below even the bottom-quartile figure for that band, which is a clearer signal than the headline. The ChartMogul report adds that for companies above $3M ARR, businesses with NRR over 100% averaged 43.6% annual growth against 13.1% for those under 60%, so expansion revenue is not a footnote.
How do I check my own churn against these numbers?
Use a fixed procedure so the number you get matches the number the benchmark describes.
- Pick the window. Use twelve months to match ChartMogul's measurement window and avoid the month-to-month noise of seasonal cancellations.
- Take the starting cohort. List every customer who was paying on day one of the window.
- Count how many of those left by the last day. New customers who joined mid-year go in a separate count.
- Divide. Annual logo churn = departures from the starting cohort ÷ starting customers.
- Pick your band by ARPA or ACV from the table above.
Sample data: 500 customers at the start of the year. 70 of them cancel before year end. 300 new customers join during the year and 45 of those also cancel before year end, so the year closes with 500 − 70 + 300 − 45 = 685 customers.
- Starting-cohort churn = 70 ÷ 500 = 14.0% (about 1.25% a month by the conversion above).
- The "all cancellations ÷ average customers" shortcut gives (70 + 45) ÷ ((500 + 685) ÷ 2) = 115 ÷ 592.5 = 19.4%.
- Dividing all cancellations by the starting count gives 115 ÷ 500 = 23.0%.
One company, three numbers, a 9-point spread, depending only on the denominator and on whether mid-year signups are counted. The starting-cohort figure is the one that lines up with a retention figure measured over a twelve-month window; check the source's definition before relying on that match. At an ARPA of about $400 a month, between the two ChartMogul extremes, 14.0% is near the top-quartile level, which is a good sign if the cohort is really that clean and a warning to check how you counted if it is not.
Why do my numbers still not match any benchmark?
Run through these five checks before concluding your churn is unusually good or bad.
- Customer versus revenue basis. A company that loses mostly small accounts has low revenue churn and high logo churn. Compare like with like.
- Billing period. Annual-plan customers can only churn at renewal, so a monthly figure for an annual-heavy base swings with renewal timing. ChartMogul attributes the sharp drop in months 11–12 of its new-business retention curves to churn on annual plans.
- Voluntary and involuntary churn. Recurly separates cancellations by choice (2.16% in the SaaS row) from failed payments (1.06%). If a benchmark combines them and you only count cancellations, you will look better than you are.
- Percentile. Top quartile, median and mean are three different bars. Only the median describes a typical company.
- Age of the base. Newly acquired customers churn faster than established ones. A fast-growing company with many first-year customers will show higher churn than a mature one with the same product quality.
If you cannot reconcile two of these five, the benchmark is not comparable and you should say so rather than force a verdict.
How do I track churn signals in TapCub?
Continue the example above: you have a 14.0% annual figure from your billing system and want to find which accounts are at risk before they cancel. TapCub does not read your billing or subscription data, so it cannot calculate subscription churn and will not produce the benchmark number. What it measures is product usage, which is where churn usually shows up first.
- Watch whether new users come back. In All-platform analytics › Behavior › Behavior analysis, open the retention analysis, pick the action that counts as activation and read the rate for each later period. A cohort that stops returning in the second week predicts the cancellations that billing will show months later. Setup is in build a retention report.
- Read the lifecycle split. The same screen shows new, retained, resurrecting and dormant counts by week or month. A growing Dormant bar means people who were active and then stopped, which is a usage signal, not a billing churn figure.
- Rank B2B accounts by health. If you call
tapcub.group('company', 'acme', {...})after login, All-platform analytics › Users › Accounts lists each account with a health score from 0 to 100, built from the share of members active in the last 30 days, the share of active days and whether anyone appeared in the last 7 or 30 days. Sort from the lowest and hand that list to customer success. - Join it to billing yourself. Match the low-score accounts to renewal dates in your billing tool. TapCub does not know the renewal date, so the match is manual or through your own export.
FAQ
What is a good churn rate for SaaS?
It depends on contract size. In the ChartMogul report, top-quartile annual logo churn runs from 36.9% for ARPA under $10 a month to 14.3% for ARPA over $500 a month. A good rate is one near the top quartile of your own ACV band, measured with the same window and definition.
Is 5% monthly churn bad?
Compounded, 5% a month is 46.0% a year, which is worse than even the top quartile of the cheapest ARPA band in the ChartMogul report (36.9% annual). For a self-serve product under $10 a month that is common; for a product over $6,000 a year it signals a serious retention problem.
Should I use customer churn or revenue churn?
Track both. Customer churn shows how many accounts leave; revenue churn shows how much money leaves. When they diverge, the gap tells you whether you are losing small or large accounts. Benchmarks publish both, so compare each one with its own counterpart.
How often should I recompute churn?
Compute it monthly so you see trends, and report the trailing twelve months for benchmarks. A single month is noisy, especially when annual renewals bunch together, so do not compare one month with an annual benchmark.
Sources
- Recurly. Churn rate benchmarks — median churn by industry and ARPC, voluntary and involuntary. Checked 2026-11-20.
- ChartMogul. SaaS Retention Report — NRR, GRR and logo retention by ARR and ARPA band, 2,100+ SaaS companies, published 2023-11-01. Checked 2026-11-20.
- SaaS Capital. Retention benchmarks for private B2B companies — median NRR by ACV band, published 2025-09-18. Checked 2026-11-20 (the site blocks automated requests; opens in a browser).
Was this article helpful?
We use your answers to fix and expand this page.
Couldn’t send. Please try again in a minute.
Thanks for the feedback. We’ll use it to improve this page.You’ve already sent feedback on this page. Thanks.

Data Engineer
Writes about event design, data quality, and collection workflows, with verifiable implementation methods for reliable analytics.