Try it on your own data
Every report in this article is in the free plan. One snippet for web and apps, up to 10 sites.
Start freeA B2B SaaS marketing strategy is a stage-by-stage plan that works backwards from the customers you need to the traffic, giving each stage a conversion rate so the numbers add up. In the sample, 12.5 customers a month needs 2,632 visitors at 3.8% to request, 50% qualified and 25% won, and costs $3,680 per customer with sales included. A weak stage lengthens payback from 5.75 to about 10 months.
What you will learn
- Work backwards from the customer target through visitor-to-request, request-to-qualified and qualified-to-won rates
- Cost the plan with benchmarks (8% of ARR on marketing, 15% on sales) and judge it by payback
- Fix the stage with the biggest gap first; the rates multiply, so one weak stage cuts customers by the same proportion
What is a B2B SaaS marketing strategy, in one plan?
A B2B SaaS marketing strategy is a stage-by-stage plan that says who you sell to, how they find you, what makes them sign up or ask for a demo, and what conversion rate each stage needs so the numbers add up to a target number of customers. The distinguishing feature is that you work backwards from the customers you need to the traffic, rather than forwards from a channel list.
That matters because B2B buyers do much of the work alone. Gartner's March 2026 release, based on 646 buyers surveyed in August and September 2025, reports that 67% prefer a rep-free experience. A strategy built around outbound alone is therefore aimed at the minority; one built around being findable, clear on price and easy to try is aimed at the majority. The wider discipline is covered in SaaS marketing, and positioning a product against its market is in SaaS product marketing; this page is the plan with numbers.
What are the stages of the plan, and what does each need to hit?
| Stage | Job | Main activities | Number to track | Sample target |
|---|---|---|---|---|
| 1. Position | Decide who it is for and why you | Ideal customer profile, one-sentence positioning, pricing page that states the model | Share of sign-ups that fit the profile | 70% fit |
| 2. Capture demand | Be found by people already looking | Search content for problems and comparisons, listings, a clear pricing page | Visitors from search; visitor to request rate | 3.8% to request |
| 3. Create demand | Reach people not yet looking | Useful content, community, partners, email list | New visitors who return; email sign-ups | 8% return within 30 days |
| 4. Convert | Turn visits into trials or demos | Landing pages, trial or demo flow, chat for questions | Request to qualified rate | 50% qualified |
| 5. Win | Get qualified requests to pay | Sales follow-up, onboarding, proof | Qualified to customer rate | 25% won |
| 6. Expand | Keep and grow accounts | Onboarding, usage reviews, win-back | Retention at week 4; expansion | 85% at week 4 |
The targets are assumptions for the worked example, not benchmarks; the rest of the page shows where they come from and how to replace them with yours. The sequence matters: stages 1, 2 and 4 come before 3, because creating demand into a leaky funnel wastes the spend.
| Stage | Number to track | Sample target |
|---|---|---|
| 1. Position | Share of sign-ups that fit the profile | 70% |
| 2. Capture demand | Visitor to request rate | 3.8% |
| 3. Create demand | New visitors who return in 30 days | 8% |
| 4. Convert | Request to qualified | 50% |
| 5. Win | Qualified to customer | 25% |
| 6. Expand | Retention at week 4 | 85% |
Targets are assumptions for the worked example; replace them with measured rates.
Worked example: working backwards from 12.5 customers a month
Sample data: a B2B SaaS company with $2,400,000 annual recurring revenue (ARR) and an average of $800 monthly recurring revenue per customer wants about 12.5 new customers a month. Work down from the goal:
| Step | Rate | Count needed |
|---|---|---|
| New customers | n/a | 12.5 |
| Qualified requests | 25% become customers | 12.5 ÷ 0.25 = 50 |
| Demo or trial requests | 50% qualified | 50 ÷ 0.50 = 100 |
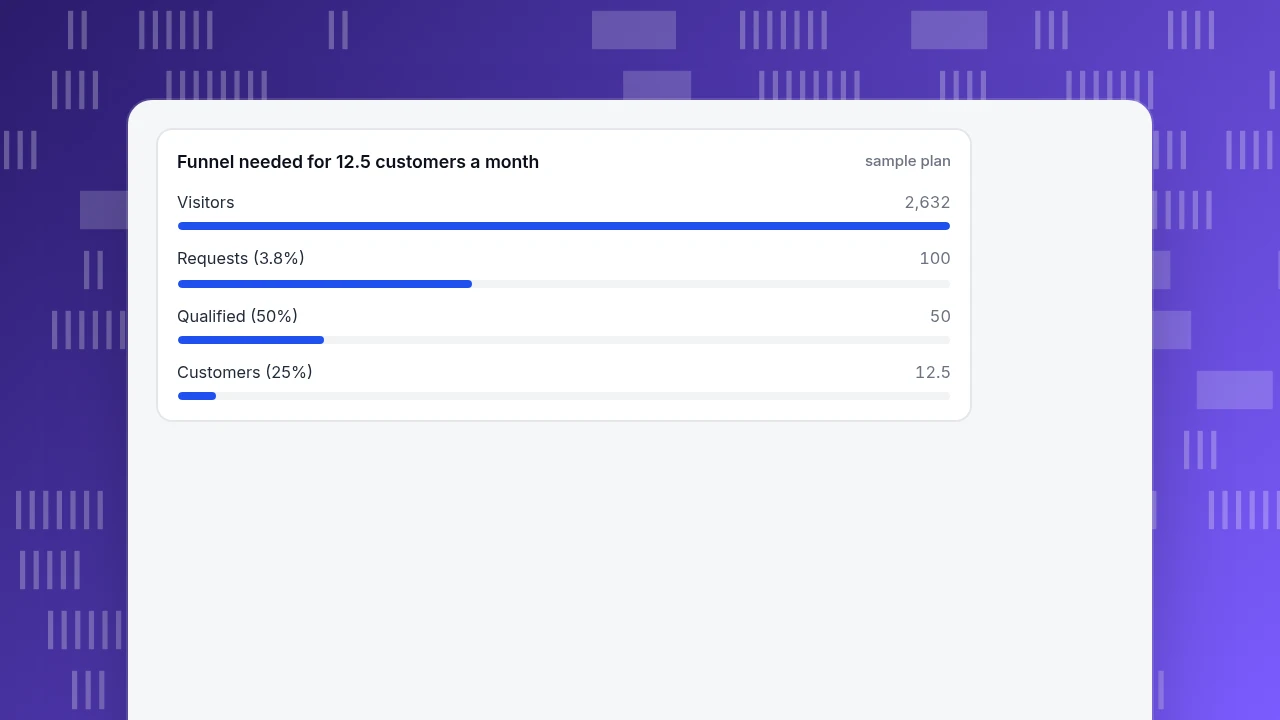
| Website visitors | 3.8% request | 100 ÷ 0.038 = 2,632 |
So 2,632 visitors a month produce 100 requests, 50 qualified requests and 12.5 customers. Multiplying forwards confirms it: 2,632 × 0.038 = 100; × 0.50 = 50; × 0.25 = 12.5.
Now cost it. Using SaaS Capital's 2026 medians of 8% of ARR on marketing and 15% on sales, $2,400,000 ARR gives:
- Marketing: $2,400,000 × 8% ÷ 12 = $16,000 a month
- Sales: $2,400,000 × 15% ÷ 12 = $30,000 a month
Marketing cost per customer is $16,000 ÷ 12.5 = $1,280, per qualified request $320 and per request $160. Including sales, the blended cost per customer is $46,000 ÷ 12.5 = $3,680. At $800 a month and an assumed 80% gross margin, a customer returns $640 of gross profit a month, so payback is $3,680 ÷ $640 = 5.75 months.
Funnel needed for 12.5 customers a month
sample planWhich stage should you fix first?
The same arithmetic shows where a weak rate hurts most. Hold spend at $46,000 a month and change one rate at a time:
| Scenario | Customers a month | Blended cost per customer | Payback (months) |
|---|---|---|---|
| Plan as above | 12.5 | $3,680 | 5.75 |
| Close rate 15% instead of 25% | 7.5 | $6,133 | 9.6 |
| Qualified rate 30% instead of 50% | 7.5 | $6,133 | 9.6 |
| Visitor-to-request 2.0% instead of 3.8%, same 2,632 visitors | 6.6 | $6,991 | 10.9 |
A drop at any one of the conversion stages cuts customers in proportion to the drop, because the rates multiply: each of the three weaker scenarios loses 40% to 47% of the customers at the same spend. For the first one, 100 requests × 0.50 = 50 qualified × 0.15 = 7.5 customers, and $46,000 ÷ 7.5 = $6,133, so payback stretches from 5.75 to $6,133 ÷ $640 = 9.6 months. The last row shows the cost of a weak page: at 2.0% the same traffic yields 2,632 × 0.02 = 52.6 requests, or 6.6 customers; to get back to 100 requests you would need 100 ÷ 0.02 = 5,000 visitors, nearly double. Fix the stage with the biggest gap to its target first, and where gaps are equal, fix the one nearest the customer because the people there are already paid for.
What conversion rates are realistic to aim for?
Use outside numbers to sanity-check, not to set targets. Unbounce's 2024 Conversion Benchmark Report puts the median landing page conversion rate for SaaS at 3.8%, 42% lower than the 6.6% all-industry median. Two cautions apply. It measures landing pages built to convert, not the whole site: visitors who land on the blog or pricing page convert at other rates. And it is a median of many companies, so your own rate can sit well above or below it.
Practical rule: start with 3.8% as the placeholder, measure your own for a month by entry page, and replace it. Expect the rate to differ a lot between paid traffic, organic search and email; see SaaS sales funnel for the funnel structure and SaaS metrics for the definitions.
How much should you spend on marketing?
SaaS Capital's 15th annual survey, completed in March 2026 with more than 1,000 private B2B SaaS respondents, reports median spend of 15% of ARR on sales (up from 13% the previous year) and 8% on marketing (unchanged). That is the 8% and 15% used above. Treat them as a starting range, not a target: a company growing fast spends more, a company on a tight cash plan spends less. The check is the payback figure: in the sample, 5.75 months against your own tolerance, and the sensitivity table shows how fast it deteriorates when a rate slips.
If measured payback is longer than your cash runway can fund, cut or redirect spend at the weakest stage rather than across the board. Trimming budget while a 3.8% page stays as it is only lowers the number of visitors, whereas the same money spent on lifting a 2.0% page back to 3.8% restores 100 requests from 2,632 visitors instead of 5,000.
What order should you do things in?
Sequence by what unlocks the next stage:
- Month 1: fix the foundation. Write the ideal customer profile and the one-sentence positioning; make the pricing page state the model; set the sign-up or demo-request goal and tag every campaign link with UTM parameters.
- Months 2 to 3: capture existing demand. Publish pages for the problems and comparisons people already search, and measure visitor-to-request by entry page.
- Months 3 to 5: fix conversion. Improve the weakest landing page, add chat on pricing and sign-up pages, and shorten the form if it loses people.
- Months 5 and on: create demand. Add content, partners and community, once the funnel converts at the planned rates.
- Every month: review the table. Recompute the plan with measured rates, and replace the sample targets.
How do you track this plan in TapCub?
Take the example above. In TapCub:
- Set the goal. In Web analytics › Goals, define the demo or trial request as a goal. It is the same data as the Business goals page.
- Read visitor to request by source. Web analytics › Sources shows channels, referrers and UTM per row with conversions in the channel table; this gives the 3.8% for each channel.
- Cost it. In All-platform analytics › Business › Channel ROI, import spend by day and channel and read cost per click, cost per acquisition and return on ad spend by channel, source or campaign.
- Compare attribution models. In All-platform analytics › Behavior › Behavior analysis, choose first-touch, last-touch, linear, position-based and time-decay together as separate columns, so a channel that mostly assists is visible.
- Check chat on the conversion pages. Live chat › Reports › Conversion attribution compares goal conversion for visitors who chatted and those who did not.
TapCub stops at the goal: qualified and won stages live in your CRM, so those two rates are numbers you bring. It does not run ads, send email or score leads.
FAQ
What is a B2B SaaS marketing strategy?
A plan that works backwards from a target number of customers to the traffic needed, through stages with a conversion rate each: visitor to request, request to qualified, qualified to customer. It names who it is for, how they find you and what each stage must hit.
What are the key components of a B2B SaaS marketing strategy?
A defined customer profile, positioning, a pricing page that states the model, search and comparison content, a conversion path (landing page, trial or demo), follow-up, and retention. The numbers that tie them together are the stage conversion rates and the cost per customer.
How much should a B2B SaaS company spend on marketing?
SaaS Capital's 2026 survey reports median marketing spend of 8% of ARR and sales spend of 15%. Use that as a starting range and test it against payback, for example 5.75 months in the sample.
What conversion rate should a B2B SaaS website aim for?
Unbounce reports a 3.8% median landing page conversion rate for SaaS in its 2024 report. Use it as a placeholder, measure your own by entry page, and expect paid, organic and email traffic to differ.
Where should a B2B SaaS marketing plan start?
With the foundation: customer profile, positioning, pricing page and a measured goal. Creating demand before the funnel converts means paying for visitors who leak out, so capture existing demand and fix conversion first.
Sources
- SaaS Capital. Spending Benchmarks for Private B2B SaaS Companies — 15th annual survey completed March 2026; median sales 15% and marketing 8% of ARR. Verified 2026-11-20.
- Unbounce. SaaS Conversion Rate Benchmarks — median SaaS landing page conversion 3.8% against 6.6% for all industries (Conversion Benchmark Report 2024). Verified 2026-11-20.
- Gartner. Gartner Sales Survey Finds 67% of B2B Buyers Prefer a Rep-Free Experience — 646 buyers, August to September 2025. Verified 2026-11-20 through the release's search listing (the page blocks automated fetches).
Was this article helpful?
We use your answers to fix and expand this page.
Couldn’t send. Please try again in a minute.
Thanks for the feedback. We’ll use it to improve this page.You’ve already sent feedback on this page. Thanks.

Product Experience Specialist
Explores usability, user journeys, and feature adoption through practical examples of onboarding and everyday product use.