Try it on your own data
Every report in this article is in the free plan. One snippet for web and apps, up to 10 sites.
Start freeA good SEO analytics report puts a decision after every number. Use six to eight metrics, show impressions, clicks, click-through rate and position change on one page, then list the pages that moved and the actions for next month. A report that only describes the month is a log, not a report.
What you will learn
- Test every line: if this number moves, what would we do? If nobody can say, delete it
- A monthly report needs 6–8 metrics, with impressions, clicks, CTR and position change on the same page
- Always break a moving metric down by page group: in the sample, impressions +20% and clicks −5% were mostly a mix effect from new page-2 pages
What is an SEO report for?
An SEO report exists to decide what to change next month. It is not a record of everything that was measured. Most reports fail because they list numbers ("organic sessions: 41,200") and stop there, so the reader nods and nothing happens.
Use one test on every line: if this number moves, what would we do? If nobody can answer, delete the line. If there is an answer, write it next to the number. That single habit turns a data dump into a decision document, and it is the difference between a log and a report.
Three consequences follow:
- Fewer numbers. Six to eight metrics are enough for a monthly report. More than that and the important change hides among the unimportant ones.
- Numbers that belong together share a page. Impressions, clicks, click-through rate and average position explain each other, so they sit side by side, not on four separate slides.
- Every report ends with an action list, with an owner and a date.
How should an SEO analytics report be structured?
Four parts, in this order. The order matters: the reader who stops after page one still gets the answer.
| Part | What goes in it | Length |
|---|---|---|
| 1. Conclusion | One or two sentences: what happened and the one thing to do about it | 2 sentences |
| 2. Core metrics | 6–8 metrics with this period, last period and change; impressions, clicks, CTR and position together | 1 page |
| 3. Exceptions | The pages or queries that moved most, each with a probable cause | 5–10 rows |
| 4. Next month | 3 actions with owner, date and the metric that will show whether they worked | 3 lines |
If you are asking how to create an SEO report from scratch, start with part 4 and work backward: decide what decisions the report should support, then pick the numbers that inform them. Templates that begin with "all available metrics" produce the long, unread reports described above.
| Report part | Question it answers | Rule of thumb |
|---|---|---|
| 1. Conclusion | What happened and what is the one thing to do? | Two sentences, readable on its own |
| 2. Core metrics | How did the main numbers change? | 6–8 metrics, this period against last, same page for related metrics |
| 3. Exceptions | Where did the change come from? | 5–10 pages, each with a probable cause |
| 4. Next month | What will we do and how will we know it worked? | 3 actions with owner, date and a metric |
Order matters: a reader who stops after page one still gets the answer.
Which 6–8 metrics belong in the report?
Pick from this list. Each row says where the number comes from and what you would do when it moves. Definitions of clicks, impressions, click-through rate and average position follow Google Search Console's Performance report.
| Metric | Where it comes from and how it is defined | If it moves, you would |
|---|---|---|
| Clicks | Search Console: the number of times a user clicked through to your site from Google results | Falling with stable impressions: check titles, snippets and position |
| Impressions | Search Console: how many times your site appeared in results | Falling: check indexing and ranking; rising with flat clicks: see the example below |
| Click-through rate (CTR) | Clicks ÷ impressions | Low on pages in the top 10: rewrite title and description |
| Average position | Search Console: the average position of the topmost result; in tables, the average for that URL or row | Read with caution: use it to find pages, not to judge success |
| Organic visitors | Your analytics: visitors whose source is organic search | Compare with clicks; a gap points to tracking or consent differences |
| Organic conversions | Your analytics: goals completed by organic visitors | Falling with stable visitors: check the landing pages' offer and speed |
| Indexed pages | Search Console page indexing report: pages indexed | A sudden drop: technical problem; see the monitoring guide |
| Share of URLs rated good | Core Web Vitals report: URL groups rated good | Falling: find the template that regressed |
Eight rows is the ceiling. For a smaller site, six (clicks, impressions, CTR, organic visitors, organic conversions, indexed pages) is plenty. For KPI definitions at a higher level, see SEO KPIs; for how many keyword rows to show, see the keyword performance report; for the broader traffic report this one sits inside, see the web analytics report.
How do you read it when impressions rise and clicks fall?
This is the case that most often confuses a report's reader. Sample data for one site, month over month:
| Last month | This month | Change | |
|---|---|---|---|
| Impressions | 100,000 | 120,000 | +20.0% |
| Clicks | 3,000 | 2,850 | −5.0% |
| CTR | 3.00% | 2.38% | −0.6 pts |
"Impressions up, clicks down" does not say whether to celebrate or worry. Break it down by page group:
| Group | Impressions (last → this) | Clicks (last → this) | CTR (last → this) |
|---|---|---|---|
| A: pages already in the top 10 | 80,000 → 82,000 | 2,600 → 2,500 | 3.25% → 3.05% |
| B: pages newly ranking on page 2 | 20,000 → 38,000 | 400 → 350 | 2.00% → 0.92% |
| Total | 100,000 → 120,000 | 3,000 → 2,850 | 3.00% → 2.38% |
Hold the CTRs constant and ask what clicks would be at this month's impressions: 82,000 × 3.25% = 2,665 for group A and 38,000 × 2.00% = 760 for group B, 3,425 in total. The actual 2,850 is 575 short. Group B explains 410 of that (71%), and group A 165 (29%).
Two different stories hide in one pair of numbers:
- Group B is a mix effect. Impressions grew because more pages entered results at lower positions, where CTR is naturally lower. Group B's share of all impressions rose from 20% to 31.7%, which drags the total CTR down even if nothing is wrong. Action: watch whether these pages move up; do not rewrite them yet.
- Group A is a real, smaller problem. The same pages got 2,000 more impressions but 100 fewer clicks. Action: check their titles and the result pages for new features that take clicks.
A report that stopped at "+20% impressions, −5% clicks" would have missed both. The fix is to always show the breakdown by page group for the metrics that moved.
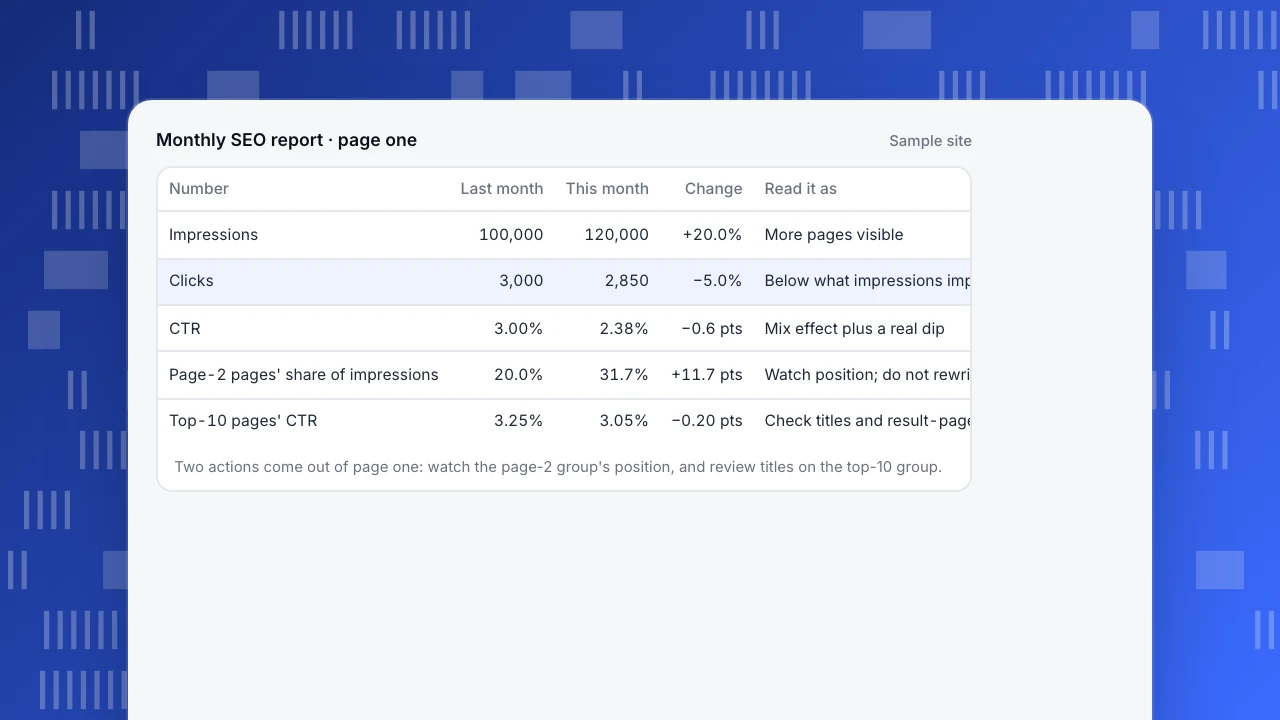
Monthly SEO report · page one
Sample site| Number | Last month | This month | Change | Read it as |
|---|---|---|---|---|
| Impressions | 100,000 | 120,000 | +20.0% | More pages visible |
| Clicks | 3,000 | 2,850 | −5.0% | Below what impressions imply |
| CTR | 3.00% | 2.38% | −0.6 pts | Mix effect plus a real dip |
| Page-2 pages' share of impressions | 20.0% | 31.7% | +11.7 pts | Watch position; do not rewrite yet |
| Top-10 pages' CTR | 3.25% | 3.05% | −0.20 pts | Check titles and result-page features |
Two actions come out of page one: watch the page-2 group's position, and review titles on the top-10 group.
How do data delays and calendars change the numbers?
Two things make a month-over-month comparison misleading before you read a single number.
Search data arrives late. Google marks the newest Search Console data as preliminary, which may change in the next few hours, and TapCub's search data is usually one to three days behind. So build the report at least three days after the period ends, and never compare a partly filled week against a complete one.
Periods have different lengths and weekday mixes. Sample data: February has 28 days and March has 31. Clicks of 3,000 against 3,300 look like +10%, but per day it is 3,000 ÷ 28 = 107.1 against 3,300 ÷ 31 = 106.5, a change of −0.6%. For weekly rhythm, prefer 28-day windows, which always contain four of each weekday, or compare the same weekdays. Seasonal sites should also look at the same month last year: Google's own guide to debugging traffic drops suggests checking whether the pattern repeats yearly.
Which pages go in the exceptions section?
The exceptions section is where the report earns its keep, because it says where to act. Use three fixed rules so the section is comparable month to month:
- The biggest click losers. Sort pages by the change in clicks and list the top five.
- Top-10 pages with CTR below the median. These are the cheapest wins: the page is already visible, and a better title and description cost only an edit.
- Pages with impressions and no clicks. They are shown but never chosen.
For each page, add one line: probable cause and proposed action. Sample data:
| Page | Impressions | CTR | Probable cause | Action |
|---|---|---|---|---|
| /pricing-guide | 24,000 | 2.1% | Title does not match the query | Rewrite title and description |
| /blog/how-to-x | 10,000 | 3.0% | Position 4, close to normal | Leave; re-check in 28 days |
| /features | 6,000 | 0.8% | Snippet shows boilerplate text | Rewrite the description |
How do you write the next-month actions and a recommendations report?
An action line has four pieces: what changed, what we will do, who and by when, and which number tells us it worked. For example: "Group B pages (38,000 impressions, CTR 0.92%) rank on page 2. We will add internal links to the five largest by 12 December, and check whether average position improves within 28 days."
If your reader wants an "SEO optimization report" or "SEO recommendations report", the same structure applies with one addition: rank the recommendations by expected clicks. A simple estimate is impressions × (target CTR − current CTR). Sample data:
| Page | Impressions | Current CTR | Target CTR | Expected extra clicks per period |
|---|---|---|---|---|
| /pricing-guide | 24,000 | 2.1% | 4.0% | 456 |
| /features | 6,000 | 0.8% | 2.5% | 102 |
| /blog/how-to-x | 10,000 | 3.0% | 4.0% | 100 |
Take the target from pages at a similar position on your own site, not from a generic benchmark. With this ranking the team starts with /pricing-guide; a list sorted by effort alone would have missed it.
What mistakes make SEO reports useless?
- Reporting rankings as the result. Position is a means. Clicks and conversions are the result; Google itself describes clicks and impressions as the main measures of success.
- Thirty metrics, no priority. If every line is bold, none is.
- Comparing unequal windows. Partial weeks, months of different lengths and holidays all create false changes.
- Branded and non-branded mixed. People who search your brand already know you, so those queries behave differently and can hide weak non-brand performance. Report them separately.
- No owner and no date on the actions. The same issue then reappears in every report.
- Not checking last month's actions. Start each report with whether last month's actions worked.
How to build this report in TapCub
Take the example above: impressions up 20%, clicks down 5%. Here is how you would produce and automate the report in TapCub.
- Connect Google Search Console or Bing Webmaster, then open Monitoring › Search performance. It shows clicks, impressions, CTR and average position by page, query and country, with a trend of clicks and impressions. The page states the date the data is current through, so you know where to cut the report.
- Look at the rank buckets, which group queries by average position and weight by impressions, to see whether the extra impressions came from lower positions, as in group B.
- On the scatter plot, each point is a page sized by impressions. Pages in the top 10 whose CTR is below the median are marked: that is the set where a better title and description pay off first, and it is your exceptions list.
- Open Web analytics › Sources and Web analytics › Pages for organic visitors and the change in visitors by page, and your goals for conversions. Mark releases and campaigns in Configuration › Annotations, so a jump has a labeled cause on the chart.
- To automate the traffic half, turn on a weekly or monthly scheduled report in Configuration › Settings › Notifications. It carries visitors, pageviews, sessions, bounce rate, average duration with period change, a trend, the fastest-rising pages and new sources, goal conversions and a short reading. Scheduled reports need a plan that includes them.
Two limits matter. The scheduled report does not include the Search Console table, so the search section of your report still comes from Search performance. And TapCub does not write recommendations for you: it supplies the numbers, and the actions stay with your team. Search data is usually 1–3 days late, and TapCub cannot show clicks or impressions for Baidu, which offers no API for them.
FAQ
What should an SEO analytics report include?
A conclusion, six to eight metrics with change versus last period, a short list of exception pages with a probable cause, and next month's actions. Include impressions, clicks, CTR and average position together, plus organic visitors and conversions from your analytics.
How often should you send an SEO report?
Monthly for decisions, weekly for monitoring. Search data is a few days late, so a weekly report built the day the week ends contains incomplete data; wait at least three days.
How do I create an SEO report from scratch?
Decide the decisions it should support, pick six to eight metrics that inform them, then pull the data for a full period and an equal previous period. Add the page groups that moved most, write the actions, and keep the same layout every month.
What is the difference between an SEO optimization report and a recommendations report?
An optimization report looks back at what changed and what was done; a recommendations report looks forward at what to do next. Combine them: results first, then actions ranked by expected extra clicks.
Why do Search Console and my analytics show different numbers?
Search Console counts clicks from Google results; your analytics counts visits it could record, which excludes people who decline tracking or block scripts. Expect a gap, and watch the trend of each, not the match.
Sources
- Performance report (Search results) (Search Console Help: definitions of clicks, impressions, CTR, position; preliminary data)
- Debugging drops in Google Search traffic (Google Search Central)
- Page indexing report (Search Console Help)
- Core Web Vitals report (Search Console Help)
Was this article helpful?
We use your answers to fix and expand this page.
Couldn’t send. Please try again in a minute.
Thanks for the feedback. We’ll use it to improve this page.You’ve already sent feedback on this page. Thanks.

Customer Experience Consultant
Writes about live chat, visitor conversations, and self-service, sharing practical ways to make customer communication clearer and more effective.