Try it on your own data
Every report in this article is in the free plan. One snippet for web and apps, up to 10 sites.
Start freeSales funnel optimization means finding the step where people drop out, working out why, and fixing that step first. Start with the step that got worse against your own history, not the biggest raw loss, then split it by source and device to tell a traffic problem from an experience problem. Below: a worked example, fix sizing and checks.
What you will learn
- Fix the step that moved against your own history, not the largest absolute loss, which is always the top
- Split by source and device: a blended rate can fall from a traffic mix shift with no page change
- Size fixes in customers per week and verify on the step you changed
What is sales funnel optimization, and where do you start?
Sales funnel optimization is the work of finding the stage where people drop out, working out why, and fixing that stage before the others. It is a diagnosis job first and a design job second. Most teams start in the wrong order: they redesign the page they dislike instead of asking which step actually got worse and whether the problem is who arrives or what they meet.
This guide follows a four-step order: find the step that moved, split it to see whether it is traffic or experience, size each fix in customers, then check the fix on the step you changed. For the stages themselves see funnel; for a B2B walkthrough of the stages see SaaS sales funnel; and for design tactics once you know the step see conversion funnel optimization. This page is about the diagnosis in between.
Which step is the real problem?
The biggest loss in raw numbers is always the first step, because the funnel narrows from the top. That tells you nothing. The useful question is which step is worse than it used to be, or worse than it should be.
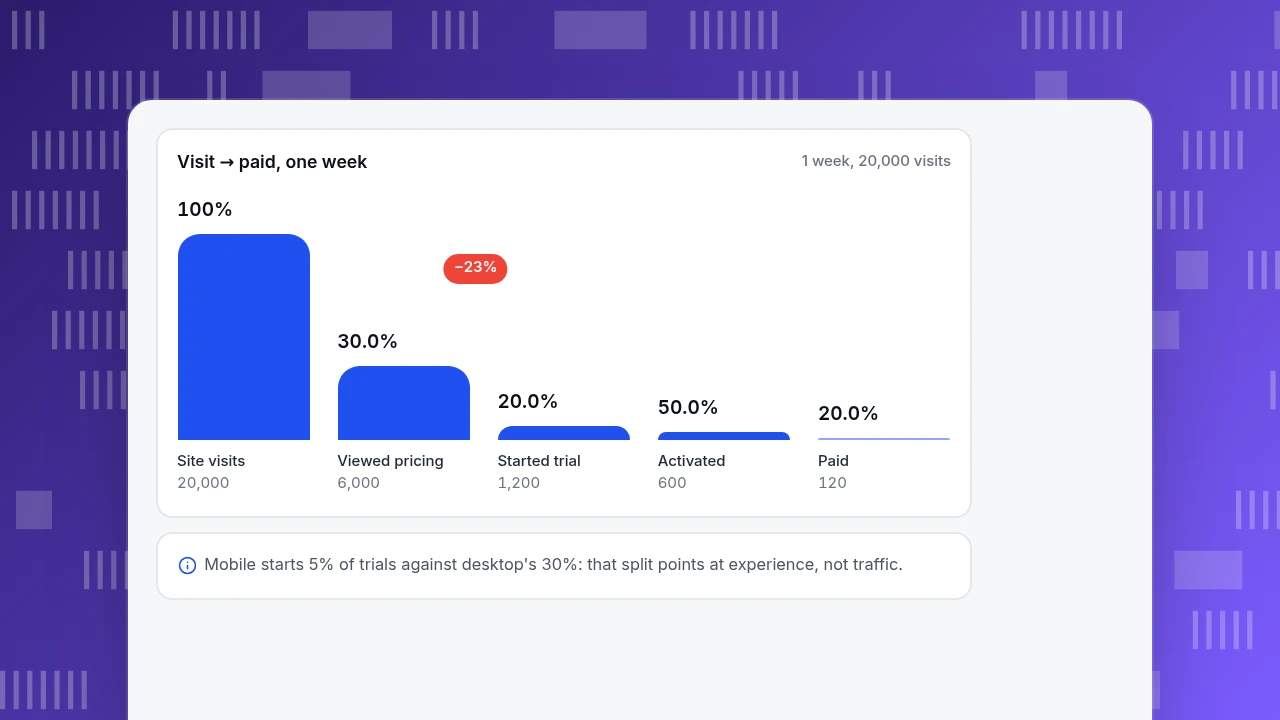
Sample data: a software company's funnel over one week.
| Step | People | Step conversion | Same step, previous 4 weeks |
|---|---|---|---|
| Site visits | 20,000 | n/a | n/a |
| Viewed pricing | 6,000 | 6,000 ÷ 20,000 = 30.0% | 33.8% |
| Started trial | 1,200 | 1,200 ÷ 6,000 = 20.0% | 26.0% |
| Activated | 600 | 600 ÷ 1,200 = 50.0% | 50.0% |
| Paid | 120 | 120 ÷ 600 = 20.0% | 20.0% |
Overall, 120 ÷ 20,000 = 0.6% of visitors pay. Only two steps moved: pricing views fell from 33.8% to 30.0% and trial starts from 26.0% to 20.0%. The trial step is the larger relative drop: 20.0 ÷ 26.0 − 1 = −23%. At last month's rate, 6,000 pricing viewers would have started 6,000 × 26.0% = 1,560 trials, not 1,200: 360 trials lost. Each trial becomes a customer at 50% × 20% = 10%, so that is 36 customers a week.
One more fact reshapes priorities. Conversion is multiplicative, so a 10% relative improvement on any single step lifts paying customers by the same 10%: 120 becomes 132. No step is magic; the right target is the one with the most headroom for the least effort, and a step that has just gotten worse has the most headroom of all. As a sanity check on outside numbers, a research institute's average of 50 documented studies puts online cart abandonment at 70.22%, an unweighted figure; use such averages to spot a wildly off funnel, never as a target.
Visit → paid, one week
1 week, 20,000 visitsSite visits
20,000
Viewed pricing
6,000
Started trial
1,200
Activated
600
Paid
120
Is it a traffic problem or an experience problem?
A funnel step is an average over different kinds of people. Split it before you change anything.
Split by source to test traffic. Sample data: 8,000 of the 20,000 visits come from paid social and 12,000 from organic search.
- Paid social: 8,000 × 15% view pricing = 1,200.
- Organic: 12,000 × 40% view pricing = 4,800.
- Together 1,200 + 4,800 = 6,000, the blended 30%.
Last month the mix was 5,000 paid social and 15,000 organic: 5,000 × 15% + 15,000 × 40% = 6,750, a blended 33.75%. Neither source got worse. The blended rate fell from 33.8% to 30.0% purely because more traffic came from the weaker source. That is a mix shift, and it is easy to mistake for a broken page. It also illustrates a general statistical trap: an association can shrink or even reverse once a population is split into subgroups.
Split by device to test experience. The 6,000 pricing viewers are 3,600 on desktop and 2,400 on mobile.
- Desktop: 3,600 × 30% = 1,080 trials.
- Mobile: 2,400 × 5% = 120 trials.
- Together 1,200 trials, the blended 20%.
Same pricing page, same offer, but mobile converts at a sixth of desktop's rate. That points at the experience.
Use this table to read the splits:
| What the split shows | Likely cause | What to check | What to change |
|---|---|---|---|
| Low rate in one source only | Traffic quality or message mismatch | The ad or link promise vs the landing page | Targeting, ad copy, landing page match |
| Low rate in every source, one device | Experience on that device | The form and layout on that device | Form length, buttons, load time |
| Low rate everywhere, started at a date | A release or content change | What shipped that day | Roll back or repair that change |
| Rate stable, volume down | Fewer arrivals, not a funnel fault | Source volumes | Acquisition, not the funnel |
| Blended rate moved, no segment moved | Mix shift | Share of traffic by source | Nothing: report segments, not blends |
| Kind of fix | Measure after | Also watch |
|---|---|---|
| Landing page or ad match | Visit-to-pricing rate for that source | Bounce and later steps for that source |
| Form or device experience | Step rate on that device | Completion time and errors |
| Onboarding or activation | Activation rate | Paid rate of those who activate |
Always measure the step you changed first; final customer counts are too small to judge in a week.
How do you size each fix before you do it?
Turn every candidate fix into customers per week, then divide by the effort.
Sample data, using the funnel above, where a trial becomes a customer at 10%:
| Candidate fix | Assumption | Extra trials | Extra customers per week |
|---|---|---|---|
| Shorten the mobile signup form | Mobile trial rate 5% → 15%: 2,400 × 15% = 360 trials, up 240 | +240 | 240 × 10% = +24 |
| Better paid-social targeting | Pricing-view rate 15% → 25%: 8,000 × 25% = 2,000 viewers, up 800, at 20% trial rate | +160 | 160 × 10% = +16 |
| Fix trial onboarding | Activation 50% → 55%: 1,200 × 55% = 660, up 60, at 20% paid | n/a | 60 × 20% = +12 |
The mobile form wins on these assumptions: 120 customers a week become 144, up 20.0%. The assumptions are guesses, so also record the effort and how confident you are; a smaller win that takes an afternoon can beat a larger one that takes a quarter. Do one change at a time so the result is attributable.
How do you check that a fix worked?
Measure the step you changed, not the final customer count. Customers are few and noisy: the expected 120 versus 144 is a gap of 24, but weekly customer counts of this size vary by roughly the square root, about 11 to 12 customers each, so the difference is within what luck can produce in one week. The mobile trial rate is a far stronger signal: 120 trials out of 2,400 (5%) versus 360 out of 2,400 (15%) is unmistakable.
Rules for the check:
- Use the same window and the same source mix before and after, or compare within a segment.
- Wait for a meaningful count at the changed step: hundreds, not dozens.
- Watch the next step too. A fix that pushes more people into trial but whose activation rate falls has moved the problem, not solved it.
- Write both numbers down: the funnel has no memory of what it looked like last month unless you saved it.
What mistakes make funnel optimization fail?
- Fixing the biggest absolute loss. The top step is always biggest. Look for the step that changed or underperforms your own history.
- Reading blended rates. A mix shift can fall a rate by 3.8 points with no page change, as in the example.
- Optimizing the final conversion alone. It is too sparse; measure the changed step.
- Changing five things at once. You will not know which one worked.
- Borrowing a benchmark. Averages hide the product, price and audience; use your own previous weeks.
- Ignoring the step after the fix. More trials with weaker activation can mean no extra customers.
How do you run this diagnosis in TapCub?
Take the funnel above. TapCub supplies the counts and splits; deciding and building the fix is yours, and TapCub does not run A/B tests or score leads.
- Build the funnel. In All-platform analytics › Behavior › Behavior analysis, choose a funnel of two to twenty steps, each an event name or page path. The window defaults to seven days (up to 180), counting is by person by default, and the order can be ordered, strict or any order.
- Read the steps. TapCub shows people, step conversion, conversion from the first step, people lost and the median time between steps, and marks the step that loses the most. Click a step to see who arrived or who dropped there.
- Split it. Group the funnel by one property; it keeps the ten groups with the most entrants and shows them side by side, which is the source or device split in the example. A saved segment from All-platform analytics › Users › Segments & tags can also be brought into the funnel. For channel-level conversion use Web analytics › Sources.
- Compare with last month yourself. The funnel has no built-in comparison period, so run it for the earlier window and write both sets of numbers down.
- Verify after the fix. Re-run with the same window and read the changed step. Sales stages that happen outside the website, such as a signed contract, only appear if you send them as events, for example through the server API.
FAQ
How do you optimize a sales funnel?
Find the step that is worse than your own history, split it by source and device to separate traffic problems from experience problems, size each fix in extra customers per week, change one thing at a time, and verify on the step you changed rather than on final sales.
What is the first thing to fix in a sales funnel?
The step that dropped compared with earlier weeks, not the largest absolute loss, which is always the top. In the sample the trial step fell from 26.0% to 20.0%, costing about 36 customers a week, so it came first.
How do you find where a sales funnel leaks?
Measure step conversion between each pair of stages and compare each with the same step in earlier weeks. Then split the weak step by source, device and date. A leak that appears in one segment is local; one that appears in all segments from a certain date is usually a release.
What is a good sales funnel conversion rate?
It depends on product, price and audience, so any single number misleads. Compare each step with your own history. Industry averages, such as the 70.22% mean cart abandonment across 50 studies, only help you spot a funnel that is far off.
How long should you wait before judging a funnel change?
Until the step you changed has hundreds of people, and across the same window and traffic mix as before. Final customer counts are too small to judge in a week; the changed step's rate is a faster, stronger signal.
Sources
- Baymard Institute. Cart abandonment rate statistics. Average documented rate 70.22% across 50 studies, an unweighted mean.
- Stanford Encyclopedia of Philosophy. Simpson's Paradox. How associations can shrink or reverse when a population is split into subgroups.
Was this article helpful?
We use your answers to fix and expand this page.
Couldn’t send. Please try again in a minute.
Thanks for the feedback. We’ll use it to improve this page.You’ve already sent feedback on this page. Thanks.

Product Analyst
Focuses on event analysis, conversion funnels, and retention, using clear metric definitions and structured analysis to explain product performance.