Try it on your own data
Every report in this article is in the free plan. One snippet for web and apps, up to 10 sites.
Start freeA SaaS go-to-market strategy answers who you sell to, through which path, and how you will tell the path is working. Choose one primary path, whether self-serve, sales-assisted or channel, and validate it with activation, CAC payback and retention instead of guessing. Below: the five decisions, when each path fits, a worked payback example and three numbers to review at day 90.
What you will learn
- Pick one primary path first; run the others as experiments until the primary one is proven
- Judge scaling paid spend on paid CAC, not blended: in the sample $200 blended is $500 paid
- Write three proof numbers with thresholds before launch: activation, CAC payback by channel and month-3 retention
The five decisions a SaaS go-to-market strategy has to make
A go-to-market (GTM) strategy is the plan for how a product reaches its first paying customers and how you know the plan is working. For a SaaS company it reduces to five decisions. If any one is left open, the plan is a list of activities, not a strategy.
| Part | Decision | Output you should be able to write down |
|---|---|---|
| Customer | Who buys, and who uses it | One segment, with the job it hires the product for |
| Offer | What problem you solve and for whom | A one-sentence positioning statement |
| Price | How it is packaged and charged | Plans, free tier or trial, price per unit |
| Path | How the product reaches the buyer | One primary path: self-serve, sales-assisted or channel |
| Proof | How you will tell the path is working | Three numbers with thresholds, decided before launch |
Most guides spend their length on the first three. The one that decides whether the others pay off is the fifth, because it forces a decision in advance about what "working" means. This guide concentrates on the path and the proof. Growth after launch, including expansion and retention loops, is in SaaS growth strategy, and the marketing channels you feed into the path are in SaaS marketing.
Three paths to market and when each fits
A path is the route from a stranger to a paying customer. SaaS companies use three, and the core advice of this guide is to pick one as the primary path, and treat the others as experiments until the primary one is proven.
| Self-serve | Sales-assisted | Channel or partner | |
|---|---|---|---|
| Who closes the deal | The buyer, alone, in the product | A salesperson, after a demo | A reseller or integration partner |
| Typical entry point | Sign-up, free plan or trial | Demo or contact request | Partner's customer base or marketplace |
| Main cost | Acquisition spend, free-tier usage | Salaries, commissions, longer cycle | Partner margin, enablement |
| Fits when | One person can reach first value alone in a session, and that person can pay | The buyer needs a security review, a custom setup or sign-off from several people | The partner already owns the relationship, or the product sits inside another workflow |
| Watch out for | Sign-ups that never activate | Deals that stall because the champion has no sponsor | Customers you cannot see or support directly |
Three rules help to choose:
- If a new user can reach the first valuable outcome alone within one session, start self-serve. If they cannot, a free plan only collects unactivated sign-ups.
- If the buyer is not the user, or the contract needs several approvals, plan on sales-assisted, even if you also offer a trial.
- If a partner already holds your buyer's attention, such as an agency, a marketplace or a platform, treat channel as the primary path and measure it as its own channel, not as a bonus.
A public example of a path built into the product is Slack. In its 2019 filing, the company reported more than 88,000 paid customers and more than 500,000 organisations on the free plan, and said about 8% of its fiscal 2019 revenue came from organisations that were on the free plan before that year and had since converted (Slack S-1). It also named what triggers the upgrade: the ability to search and access beyond 10,000 messages, the limit on the free plan. The point is not the number, which is Slack's own. The point is that a self-serve path has a designed moment where free becomes paid, and it needs something to measure that moment. More on measuring product-led paths is in product-led growth metrics, and the concept is in product-led growth.
The mix of digital and personal contact is also changing. Gartner forecast in 2020 that 80% of B2B sales interactions between suppliers and buyers would occur in digital channels by 2025 (Gartner). That makes even a sales-assisted path depend on measurable digital steps before and after the call.
Worked example: CAC payback for a self-serve and a sales-assisted path
Sample data: one company evaluates the two paths for a month. Gross margin is 80% on both.
Self-serve
- Spend (ads, content, tools): $30,000, producing 150 new paying customers.
- CAC = 30,000 ÷ 150 = $200.
- Average revenue per account (ARPA): $60 a month, so gross profit per customer is 60 × 0.80 = $48 a month.
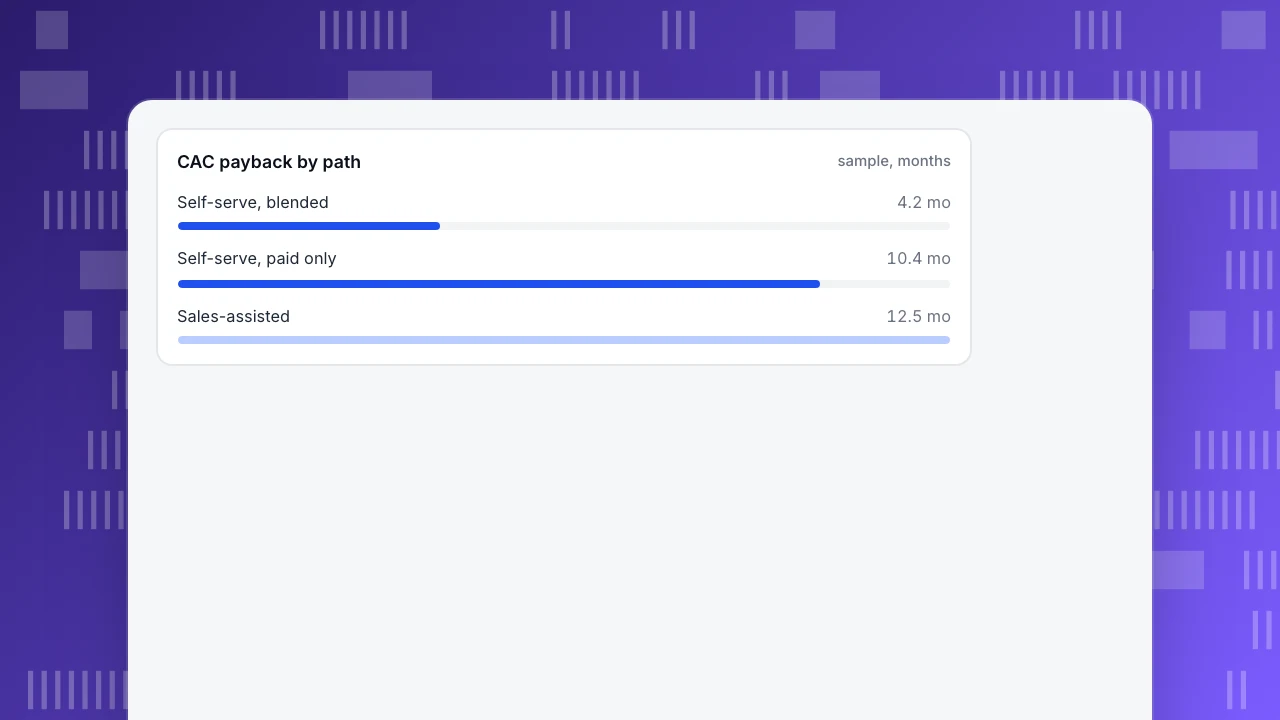
- CAC payback = 200 ÷ 48 = 4.2 months.
- Monthly churn 4%, so lifetime value (LTV) = 48 ÷ 0.04 = $1,200, and LTV : CAC = 1,200 ÷ 200 = 6.0.
Sales-assisted
- Spend (two reps fully loaded, plus marketing): $90,000, producing 15 new customers.
- CAC = 90,000 ÷ 15 = $6,000.
- ARPA $600 a month, gross profit per customer 600 × 0.80 = $480 a month.
- CAC payback = 6,000 ÷ 480 = 12.5 months.
- Monthly churn 1.5%, so LTV = 480 ÷ 0.015 = $32,000, and LTV : CAC = 32,000 ÷ 6,000 = 5.3.
| Self-serve | Sales-assisted | |
|---|---|---|
| CAC | $200 | $6,000 |
| Gross profit per customer per month | $48 | $480 |
| CAC payback | 4.2 months | 12.5 months |
| LTV (simple) | $1,200 | $32,000 |
| LTV : CAC | 6.0 | 5.3 |
Two common guidelines come from David Skok's SaaS metrics work: a lifetime value more than three times the cost of acquiring a customer, and recovering that cost within about 12 months, with many strong businesses recovering it in 5 to 7 months (Skok). On those, both paths clear the ratio, but only self-serve clears the payback test. The sales-assisted path is profitable over a lifetime and expensive in cash: it waits more than a year to get each customer's acquisition cost back. If ARPA were 10% higher at $660, gross profit per customer would be $528 and payback 6,000 ÷ 528 = 11.4 months, which shows how sensitive the result is to price. LTV here uses the simplest form, monthly gross profit ÷ monthly churn, which assumes constant churn; use it for comparing paths, not for forecasting. The formal definition of the payback metric is in CAC payback period.
Blended CAC hides which channel pays for the path
Continue the self-serve example. Of the 150 new customers, 90 came from organic search, direct visits and referrals, which the $30,000 did not buy. Only 60 came from paid channels.
- Blended CAC = 30,000 ÷ 150 = $200, payback 4.2 months.
- Paid CAC = 30,000 ÷ 60 = $500, payback = 500 ÷ 48 = 10.4 months.
Both are correct; they answer different questions. Blended CAC describes the business today. Paid CAC describes what the next $30,000 will buy if you scale the paid channel, because organic customers do not grow when you add spend. Judge a plan to scale paid spend on paid CAC, by channel, and judge the overall path on blended. Reporting only the blended number is the most common way a self-serve GTM looks cheaper than it is.
Three numbers that tell you whether the path is working
The fifth part of the plan, proof, is three numbers, each with a threshold written down before launch. The thresholds below are samples; set yours from the economics above.
| Number | Formula | Sample threshold | If missed |
|---|---|---|---|
| Activation within 14 days | Sign-ups that reach the key action ÷ sign-ups | At least 30% | Fix onboarding before adding spend |
| CAC payback, by channel | CAC ÷ monthly gross profit per customer | 12 months or less | Cut or reprice the channel; raise ARPA |
| Cohort retention at month 3 | Customers of a cohort still active at month 3 ÷ cohort | At least 85% of paying accounts | Look at who churns: wrong segment or weak product fit |
For a sales-assisted path, replace the first number with the share of demos that become qualified opportunities, but keep the other two. Review at day 90, with enough customers in each cohort to read a rate; under about 30, treat a percentage as a hint. If the three numbers are acceptable, double down on the path. If one fails, the table already says where to look.
Signs you picked the wrong path
The first path is a bet. Three patterns tell you to change it:
- Self-serve sign-ups include large teams. If some trial accounts reach several active members in the first 30 days, a salesperson can help them reach a bigger plan. Add a sales-assist step for those accounts only; the product-qualified lead concept is in product-qualified lead.
- Sales-assisted payback is above 12 months, but buyers reach value alone. Demos are costing more than the deal needs. Test a self-serve plan at a lower price for the smaller segment.
- A partner's customers retain better than yours. If partner-sourced cohorts hold at 90% at month 3 against 80% for paid search (sample figures), move budget to enabling that partner.
Mistakes in SaaS go-to-market plans
- Running three paths at once with one team. Each needs different people, tools and metrics. Prove one, then add the next.
- Reporting blended CAC when scaling paid. The example above: $200 blended against $500 paid.
- Counting sign-ups as customers. A free sign-up has not paid. Use paying customers in the CAC denominator.
- Judging the path on revenue before retention. A month of sales that churns by month 3 is acquisition cost with no return.
- Copying another company's path. A path fits a price, a buyer and a time to value. Write down why yours fits.
How to validate a GTM path in TapCub
Take the self-serve path from the example: $30,000 of spend, 150 customers and a question about which channels deserve more money.
- See where visitors come from. Web analytics › Sources groups visitors by channel and UTM parameters, so you can check that paid campaigns carry consistent UTM tags before you judge them.
- Put the spend next to the results. On All-platform analytics › Business › Channel ROI, open the Costs tab and add spend per day, channel, source and campaign, one row at a time or by CSV. The page then shows cost per click (spend ÷ sessions), cost per acquisition (spend ÷ conversions) and return on ad spend, grouped by channel, source or campaign. Conversions on that page are purchases recorded on the order ledger; if your subscriptions are not recorded as orders, compute CAC yourself from your own count of new paying customers.
- Check activation and retention by channel. In All-platform analytics › Behavior › Behavior analysis, build a funnel from sign-up to your key action to first payment and break it down by channel (the first breakdown layer keeps the 10 groups with the most entries). Then open retention on the same people to read month-3 retention by cohort.
- Compare attribution models side by side. The attribution view in the same builder can show first-touch, last-touch, linear, position-based and time-decay credit in separate columns, with a lookback window of 30 days by default, so channels that only assist show up.
- Know the boundary. TapCub is not a CRM and has no sales pipeline, so a sales-assisted path's demos and closed deals live in your CRM; it does not calculate LTV or payback either. Take its spend, sessions, conversions and retention into your own sheet, and write the three thresholds there.
FAQ
What is a SaaS go-to-market strategy?
It is the plan for how a SaaS product reaches its first paying customers and how you will know it is working. It decides who buys, what you offer, the price, the path to market (self-serve, sales-assisted or channel) and the numbers that prove the path. The path and the proof are the parts most plans leave vague.
What are the main SaaS go-to-market models?
Three paths: self-serve, where the buyer signs up and pays alone; sales-assisted, where a salesperson closes after a demo; and channel, where a reseller or platform partner brings the customer. Pick one as the primary path, prove it with payback and retention, and only then add a second.
How do you measure whether a GTM strategy is working?
Use three numbers with thresholds set before launch: activation in the first 14 days, CAC payback by channel, and cohort retention at month 3. Review at day 90. If one number misses, the table says where to look: onboarding, channel economics or customer fit.
What is a good CAC payback period for SaaS?
A common guideline is to recover customer acquisition cost within about 12 months, and strong businesses often manage 5 to 7 months, according to David Skok's work. Larger companies with cheap capital can accept longer. Compute it by channel and by path; a blended figure can hide a slow paid channel.
How is GTM different from a marketing strategy?
Marketing strategy is how you create demand through channels and messages. A go-to-market strategy is wider: it also fixes the customer, offer, price, path and proof. The marketing plan feeds the path but does not decide whether the path fits your price and buyer.
Sources
- David Skok. SaaS Metrics 2.0: A Guide to Measuring and Improving What Matters. For Entrepreneurs. Guidelines on LTV : CAC above 3 and CAC recovery within 12 months, with strong businesses at 5–7 months. Read 2026-11-17.
- Slack Technologies, Inc. Form S-1, 2019. Paid customers, free-plan organisations, the share of fiscal 2019 revenue from converted free organisations and the 10,000-message limit. Read 2026-11-17.
- Gartner. Gartner Says 80% of B2B Sales Interactions Between Suppliers and Buyers Will Occur in Digital Channels by 2025. Press release, 15 September 2020. Title checked 2026-11-17; the page returns 403 to scripts.
Was this article helpful?
We use your answers to fix and expand this page.
Couldn’t send. Please try again in a minute.
Thanks for the feedback. We’ll use it to improve this page.You’ve already sent feedback on this page. Thanks.

Product Adoption Consultant
Explores customer onboarding, live conversations, and self-service, turning common usage questions into practical guidance and improvements.