Try it on your own data
Every report in this article is in the free plan. One snippet for web and apps, up to 10 sites.
Start freeA SaaS growth strategy decides which part of the customer lifecycle to fix next and how. Choose it from the number that is most stuck, not from the most fashionable playbook: measure acquisition, activation, retention and expansion as rates, convert each gap into revenue, and start with the biggest. In the example below, activation is worth more than every other gap combined.
What you will learn
- Measure each AARRR stage as a rate and compare it with your own best recent results, not with generic benchmarks
- Convert every gap into MRR: closing activation from 25% to 40% adds $4,320 a month, more than all other gaps combined ($1,980)
- Put a quarter of focused effort on the bottleneck, check other stages for side effects, then recompute
How do you find the stage that limits your growth?
A SaaS growth strategy is a plan for which part of the customer lifecycle to improve next — acquisition, activation, retention, expansion or referral — and how. Most lists of growth strategies skip the "which" and jump to tactics: launch on a marketplace, add a referral program, run more webinars. Each tactic works for some company. Whether it works for yours depends on which stage is actually holding you back.
The stages come from Dave McClure's Startup Metrics for Pirates (2007), usually shortened to AARRR: acquisition, activation, retention, revenue and referral. The framework itself is explained in AARRR. For SaaS, it helps to read "revenue" as two things: the first payment and the expansion that follows.
The diagnosis takes three steps:
- Measure each stage as a rate, not a count: visitor-to-signup, signup-to-activated, activated-to-paid, monthly churn, expansion revenue as a share of starting revenue.
- Compare each rate with a reference you could realistically reach. Industry benchmarks are tempting but rarely comparable: they mix price points, sales models and definitions. A better reference is your own best month or cohort in the last 12 months, or a plan the team already believes in.
- Translate each gap into revenue. A 10-point gap in one stage and a 1-point gap in another are not comparable until you convert both into dollars of monthly recurring revenue (MRR).
The stage with the largest revenue gap is your bottleneck, and your growth strategy for the quarter starts there. That is the thesis of this article: pick strategies from the number that is most stuck, not from the most fashionable playbook. The table below lists, for each stage, the rate to watch, a warning sign and the family of strategies that fixes it. How to choose a first lever when you are just starting out is covered in which AARRR lever to pull first.
| Stage | Rate to watch | Warning sign | Strategy family |
|---|---|---|---|
| Acquisition | Visitor-to-signup rate; activated trials per channel | Trials grow but activated trials do not | Intent-focused content, high-intent paid search, partners |
| Activation | Share of signups completing the key action in week one | Many log in, few reach the key action | Fewer setup steps, sample data, targeted nudges |
| Retention | Monthly logo churn; active members per account | Active members per account declining before renewal | Churn signals, team onboarding, exit reasons |
| Revenue and expansion | Activated-to-paid rate; net revenue retention | Customers hit plan limits but do not upgrade | Value-metric pricing, upgrade prompts at limits |
| Referral | Share of signups referred by users | Shares happen but referred users do not activate | Built-in sharing, incentives only once earned |
Compare each rate with your own best month or cohort of the last 12 months; then convert the gap into MRR before choosing.
Worked example: which stage is most stuck?
Sample data: a B2B SaaS product with a free trial, one month.
- 50,000 website visitors.
- 3.0% sign up: 50,000 × 3.0% = 1,500 trials.
- 25% activate (complete the key setup action in their first week): 1,500 × 25% = 375.
- 24% of activated trials pay: 375 × 24% = 90 new customers.
- Average revenue per account $80 per month, so new MRR = 90 × $80 = $7,200.
- The installed base is 1,000 customers; monthly logo churn is 4%.
- Expansion MRR (upgrades and added seats) is $1,600 a month.
The team's best months over the past year give the reference: signup 3.2%, activation 40%, activated-to-paid 25%, churn 3%, expansion $2,000.
Now close each gap one at a time, holding the others constant, and measure the change in MRR per month:
- Signup 3.0% → 3.2%: 1,600 trials → 400 activated → 96 paid. +6 customers, +$480 new MRR.
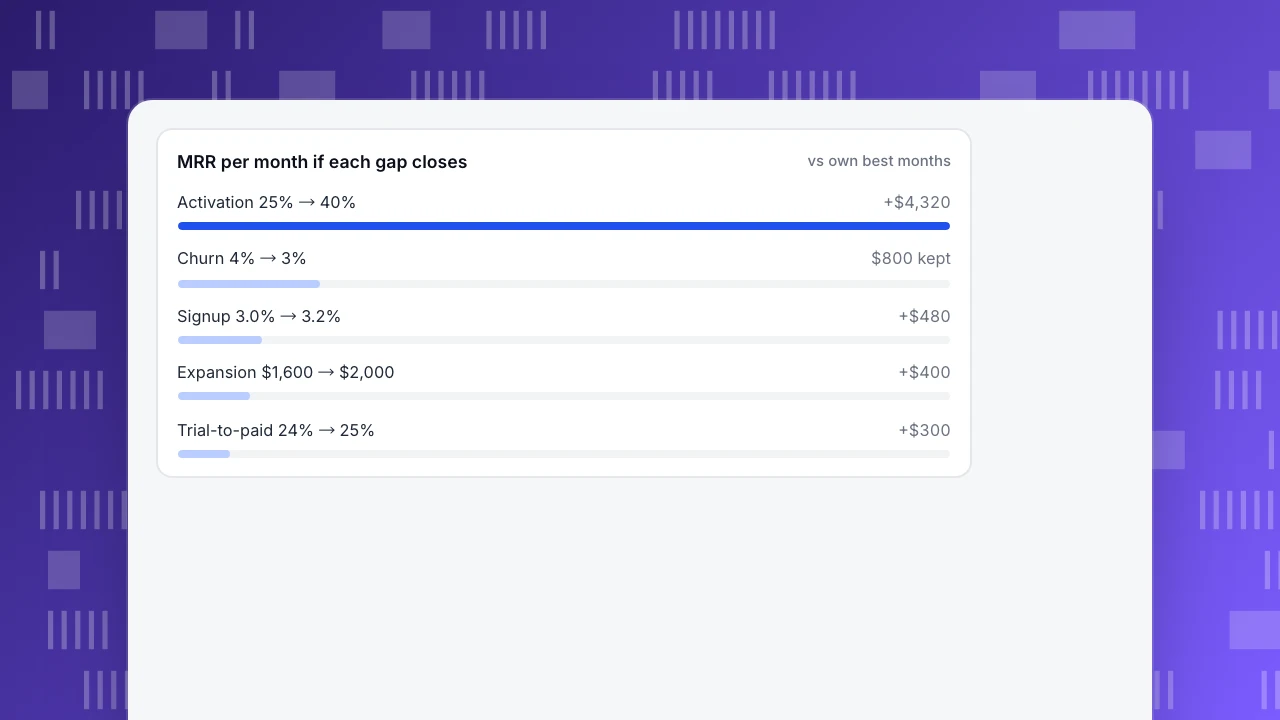
- Activation 25% → 40%: 1,500 → 600 activated → 144 paid. +54 customers, +$4,320 new MRR, a 60% jump.
- Activated-to-paid 24% → 25%: 375 → 93.75 paid. +3.75 customers, +$300.
- Churn 4% → 3%: 1% of 1,000 customers is 10 fewer lost each month, $800 of MRR kept.
- Expansion $1,600 → $2,000: +$400 MRR.
Activation is the bottleneck by a wide margin: closing its gap is worth more than all the other gaps combined ($480 + $300 + $800 + $400 = $1,980). Even closing only half of it, from 25% to 32.5%, adds 1,500 × 32.5% × 24% = 117 paid, +27 customers or +$2,160, still more than any other single fix.
Notice what a popular playbook would have suggested. "Drive more traffic" targets the signup stage, worth $480. "Launch a referral program" targets acquisition again. Both are reasonable tactics; neither touches the stage where most of the money leaks. The same funnel with a 9% churn rate and 40% activation would point the other way, to retention.
Two caveats. The stages interact: more aggressive acquisition often lowers activation, because new traffic is less qualified, so recheck all rates after any change. And retention gains compound — every customer kept this month is still paying next month — which is why research on customer valuation finds retention unusually powerful. In Gupta, Lehmann and Stuart's Valuing Customers study of five companies, improving retention by 1% improved customer and firm value by 3–7%, compared with about 1% for margin and 0.02–0.3% for acquisition cost. When retention is the biggest gap, it deserves priority even if its monthly number looks modest.
MRR per month if each gap closes
vs own best monthsWhat strategies work at each stage?
Once you know the bottleneck, choose two or three strategies for that stage and park the rest. These are the ones that most often move each rate.
Acquisition: more of the right visitors
- Content for problems your product solves, not broad industry topics. Judge it by trials and activated trials per page, not traffic.
- Paid search on high-intent terms, measured on activated trials per dollar. A channel that brings many trials that never activate is making your bottleneck worse.
- Partners and integrations where your buyers already work. Smaller volume, better fit. How to qualify these leads by product behavior is in SaaS lead generation.
Activation: reaching value in the first week
- Define one key action that predicts payment, from your own data: compare paid rates of trials that did and did not do it.
- Cut every step before it. Remove fields from signup, offer sample data, pre-build the first dashboard or project. Each step removed is a share of trials that no longer drops out.
- Nudge the stuck. Trials that log in but do not reach the key action within three days get one specific prompt — an email or in-app message pointing to the next step, not a generic "need help?". Which metrics show activation progress is covered in product-led growth metrics.
Retention: keeping paying customers
- Find the leading signal of churn, usually declining active users per account or a feature that stops being used, and act before renewal.
- Onboard the account, not just the buyer. Check in your own data whether accounts with several active members churn less than single-user accounts; if they do, invite flows and team setup become retention work, not just onboarding.
- Ask churned customers why, in their words, and group the answers. If most reasons are fit, the fix is upstream in acquisition.
Expansion: growing revenue per customer
- Price on a value metric that grows with usage — seats, projects, volume — so expansion happens without a sales call.
- Prompt upgrades at limits, when the customer hits a plan boundary while trying to do something, not by email out of the blue.
- Track net revenue retention: starting MRR plus expansion minus contraction and churn, divided by starting MRR. The definition is in net revenue retention.
Referral: customers bringing customers
- Make sharing part of using the product: shared reports, invited collaborators and public links bring in new users naturally.
- Add an incentive only after the product earns referrals on its own. A reward bolted onto a product people do not yet recommend buys low-quality signups.
How should you sequence and resource growth work?
Growth work fails more often from spreading effort than from choosing the wrong tactic. A simple operating rhythm keeps the team on the bottleneck:
| When | What to do | Output |
|---|---|---|
| Start of quarter | Recompute every stage rate and the revenue gap, as in the example | One named bottleneck stage and a target rate |
| Weeks 1–10 | Run two or three strategies on that stage; ship, measure, keep or drop | A log of changes with dates and the rate before and after |
| Every month | Check all stage rates, not just the target, for side effects | A note if another stage dropped |
| End of quarter | Measure the target rate against its reference; recompute all gaps | Keep the same bottleneck or move to the next one |
Rules that keep it honest. Put most of the quarter's growth effort on the bottleneck and keep only maintenance on the rest. Set the target as a rate (activation 25% → 32%), not as an activity count (send 10 onboarding emails). Write down what you changed and when, so a rise or fall can be traced to a cause. And expect the bottleneck to move: once activation reaches 40%, conversion to paid or churn may become the stage with the biggest gap.
Before any of this, check that the product is wanted. If retention stays low however well people activate, the problem is likely product-market fit, not growth tactics; how to tell is covered in product-market fit.
What are the most common SaaS growth strategy mistakes?
- Copying a playbook without a diagnosis. A referral program cannot fix an activation problem.
- Comparing with industry benchmarks instead of your own best results. Different prices, sales models and definitions make most benchmarks misleading.
- Working on every stage at once. Five half-funded projects rarely move any rate.
- Measuring counts instead of rates. More trials can hide a falling activation rate.
- Ignoring side effects. A traffic push that lowers activation can leave paid customers flat.
- Treating retention as a later problem. Retention gains compound; a churn gap that looks small per month grows large over a year.
How to diagnose your growth bottleneck in TapCub
TapCub measures each stage; it does not run A/B tests, send onboarding emails or set prices — those stay in your product and marketing tools. Here is the worked example in TapCub:
- See all five stages side by side. All-platform analytics › Business › AARRR growth shows acquisition (new users, by channel), activation (people and rate), day-7 retention, revenue (buyers, ARPU, paying rate from the order ledger) and referral (shares and referred new users). Map your signup, activation, payment and share events once; activation starts empty, so set it to the key action, such as "connected a data source". Annual targets show year-to-date progress.
- Find where activation leaks. In All-platform analytics › Behavior › Behavior analysis, build a funnel from signup through each setup step to the key action to see which step loses the most trials, and use paths to see what stuck trials do instead.
- Watch retention and lifecycle. The retention report in the same place shows whether a cohort comes back in week or month N. The lifecycle view splits active users into New, Returning, Resurrecting and Dormant each week or month, so you can see whether growth comes from new users or from bringing back old ones.
- Follow accounts for B2B retention. With
tapcub.loginandtapcub.group('company', id, {...}), All-platform analytics › Users › Accounts shows each account's members, 30-day activity and a 0–100 health score (active-member share, active days, recency), an early signal for the churn gap before renewal. - Mark what you changed. Add an annotation in Configuration › Annotations on the day you ship an onboarding change, so the activation rate before and after is easy to read in the next quarterly review.
FAQ
What is a SaaS growth strategy?
A SaaS growth strategy is a plan for which part of the customer lifecycle to improve next — acquisition, activation, retention, expansion or referral — and the specific changes that will improve it. A good one starts from diagnosis: measure each stage as a rate, compare it with a realistic reference, translate each gap into revenue, and focus on the biggest gap for a quarter.
How do you grow a SaaS business?
Find the stage with the largest revenue gap and fix that first. In the example, closing the activation gap was worth $4,320 of new MRR a month, more than all other gaps combined. Then run two or three strategies on that stage for a quarter, check other stages for side effects, and recompute the gaps before choosing the next focus.
What are the main SaaS growth strategies?
They map to the lifecycle: content, paid search and partners for acquisition; a defined key action and shorter setup for activation; churn signals and team onboarding for retention; value-metric pricing and upgrade prompts at plan limits for expansion; and built-in sharing for referral. Which ones matter depends on your bottleneck, not on how popular a tactic is.
Should SaaS companies focus on acquisition or retention?
Neither by default; focus on whichever has the larger revenue gap. Retention deserves extra weight because its gains compound: Gupta, Lehmann and Stuart found that a 1% retention improvement raised customer value by 3–7%, against about 1% for margin. If churn is well above your own best months, fixing it usually beats buying more traffic.
How often should you revisit your SaaS growth strategy?
Recompute stage rates and revenue gaps at the start of each quarter, and check all stage rates monthly for side effects. Keep the same bottleneck while its rate is still improving toward its reference; move on once it reaches the reference or another stage's gap becomes larger. Revisit sooner after a major pricing, packaging or onboarding change.
See also: SaaS Go-to-Market Strategy: Choose One Path, Then Prove It Works.
See also: Growth marketing strategies: find the bottleneck, then pick the tactic.
See also: Monetization Models: Seven Types and the Metric for Each.
Sources
- Dave McClure. Startup Metrics for Pirates: AARRR! (2007) — the original acquisition, activation, retention, revenue, referral framework. Verified 2026-11-15.
- Gupta, Lehmann & Stuart. Valuing Customers (working paper version; published in Journal of Marketing Research 41(1), 2004) — retention, margin and acquisition-cost elasticities. Verified 2026-11-15.
Was this article helpful?
We use your answers to fix and expand this page.
Couldn’t send. Please try again in a minute.
Thanks for the feedback. We’ll use it to improve this page.You’ve already sent feedback on this page. Thanks.

Product Adoption Consultant
Explores customer onboarding, live conversations, and self-service, turning common usage questions into practical guidance and improvements.