Try it on your own data
Every report in this article is in the free plan. One snippet for web and apps, up to 10 sites.
Start freeA monetization model is how a product turns users or usage into revenue. The seven common ones are subscription, freemium, usage-based, advertising, transaction fees, in-app purchases and one-time purchases, and each has one metric that shows whether it works: churn, free-to-paid conversion, revenue per account, eCPM, net take rate, payer share, or conversion and refunds. Below, each gets a recomputed sample, and the fees that decide what you keep.
What you will learn
- Each model has its own key metric: churn, free-to-paid conversion, revenue per account, eCPM, net take rate, payer share or conversion
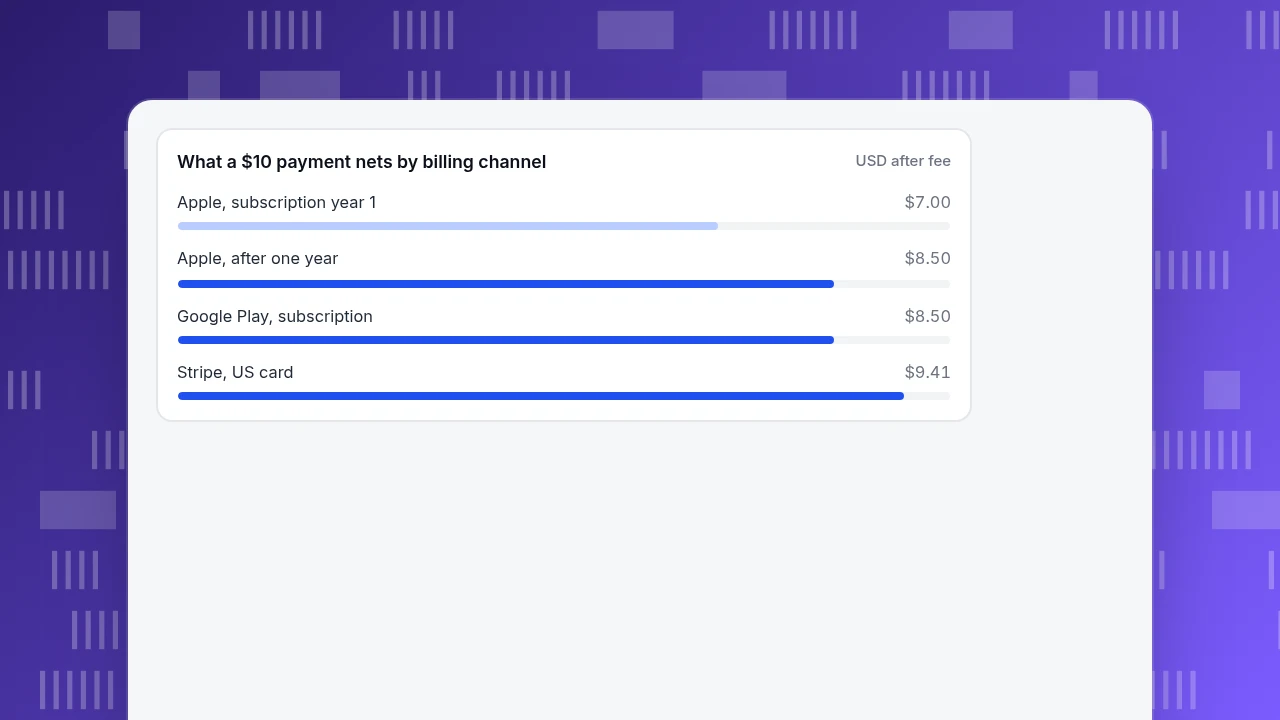
- The same $10 subscription nets $7.00, $8.50 or $9.41 depending on billing channel, so model the two together
- Define the conversion denominator first: Spotify's paid share of active users and Dropbox's of registered users are not comparable
What is a monetization model, and which seven are there?
A monetization model is the way a product turns users or usage into revenue: who pays, for what, and how the amount grows. It sits above pricing (what number goes on the price tag) and next to the revenue model (the line items in the accounts). Most products fit one of seven models, or a mix. Each has one metric that tells you whether it is working.
| Model | Who pays, for what | Revenue formula | Key metric |
|---|---|---|---|
| Subscription | Customers pay a recurring fee for access | Subscribers × price per period | Monthly churn (and MRR) |
| Freemium | A free tier for everyone, paid tier for a share | Active users × paid share × price | Free-to-paid conversion |
| Usage-based | Customers pay per unit consumed | Units × price per unit | Revenue per active account, and expansion |
| Advertising | Advertisers pay to reach users | Impressions ÷ 1,000 × eCPM | eCPM and ad revenue per daily active user |
| Transaction fee | Marketplace takes a cut of each sale | Gross merchandise value × take rate | Take rate net of payment costs |
| In-app purchases | Users pay for items or upgrades in the app | Active users × payer share × average spend per payer | Payer share and spend per payer |
| One-time purchase or licence | Customers pay once | Units × price, less refunds | Conversion rate and refund rate |
The point of the table is that the key metric differs by model. A subscription business that watches only revenue misses churn; a marketplace that watches only gross sales misses what the take rate leaves after payment costs. The sections below compute one sample of each.
| Model | Revenue formula | Key metric |
|---|---|---|
| Subscription | Subscribers × price per period | Monthly churn (and MRR) |
| Freemium | Active users × paid share × price | Free-to-paid conversion |
| Usage-based | Units × price per unit | Revenue per active account, and expansion |
| Advertising | Impressions ÷ 1,000 × eCPM | eCPM and ad revenue per daily active user |
| Transaction fee | Sales × take rate | Take rate net of payment costs |
| In-app purchases | Active users × payer share × spend per payer | Payer share and spend per payer |
| One-time purchase | Units × price, less refunds | Conversion rate and refund rate |
Choose one primary metric and two checks per model, measured the same way every month.
Seven models, one sample each
Sample data: seven separate businesses, not one product. The numbers are illustrative and recomputed.
| Model | Sample inputs | Monthly revenue | What the key metric says |
|---|---|---|---|
| Subscription | 2,000 subscribers × $15 | $30,000 | Churn of 3% a month means an average life of 1 ÷ 0.03 = 33.3 months and lifetime revenue of $15 ÷ 0.03 = $500 per subscriber |
| Freemium | 100,000 active users × 2.6% paying × $12 | $31,200 | 2,600 paying users; doubling the paid share to 5.2% doubles revenue, which is far cheaper than doubling the free base |
| Usage-based | 40,000,000 calls × $0.002 across 200 accounts | $80,000 | $400 per account a month; revenue follows usage, so the question is whether usage per account grows |
| Advertising | 3,000,000 impressions × $4 per thousand | $12,000 | Revenue scales with impressions and eCPM: at the same eCPM, ten times the impressions earns ten times this |
| Transaction fee | $400,000 in sales × 10% take rate | $40,000 | If the marketplace pays card fees of 2.9% + $0.30 on 8,000 orders of $50 ($14,000), net take is $26,000, or 6.5% of sales |
| In-app purchases | 50,000 active users × 3% payers × $20 | $30,000 gross | A 30% store fee leaves $21,000; at a 15% fee $25,500 |
| One-time purchase | 1,200 units × $49, with 5% refunds | $55,860 | No recurring base: every month starts again from conversion |
Three patterns are worth noticing:
- Recurring models are judged on retention, one-time models on conversion. The same $30,000 in a month means different things: for a subscription it recurs unless churn eats it; for a one-time sale it has to be earned again.
- Advertising depends on scale. At $4 per thousand impressions, 3,000,000 impressions earn only $12,000, so traffic volume is the main lever.
- Transaction models should be read after costs. The 10% take rate in the sample is a 6.5% net take if the platform covers payment fees.
What platform and payment fees take
Revenue is not income. Where you collect the money changes what you keep, and the fee schedules are public.
| Channel | Fee (from the provider's own page) | Net on a $10 payment | Net on a $2 payment |
|---|---|---|---|
| Apple App Store, auto-renewable subscription, first year | 30% (70% to you) | $7.00 | $1.40 |
| Apple, after one year of paid service | 15% (85% to you) | $8.50 | $1.70 |
| Apple, Small Business Program | 15% from the first billing cycle | $8.50 | $1.70 |
| Google Play, auto-renewing subscription (outside regions with their own fee schedules) | 15% | $8.50 | $1.70 |
| Stripe, domestic US card | 2.9% + $0.30 per transaction | $9.41 | $1.64 |
Two things follow. First, the same $10 subscription yields $7.00, $8.50 or $9.41 depending on where it is sold, so the monetization model and the billing channel have to be modelled together. Second, a fixed fee punishes small payments: $0.358 on a $2 charge is a 17.9% fee, against 5.9% on $10. Models built on very small payments (micro-transactions, per-article sales) need bundling or minimums to keep the fee share down.
What a $10 payment nets by billing channel
USD after feeWhat real freemium conversion looks like
Two public companies show how far apart freemium conversion can be, and why you must be careful about the denominator.
- Spotify, in its fourth-quarter 2025 results, reported 290 million Premium subscribers and 751 million monthly active users. Premium subscribers are 290 ÷ 751 = 38.6% of monthly active users.
- Dropbox, in its fourth-quarter 2024 results, reported 18.22 million paying users and described itself as having more than 700 million registered users. That is at most 18.22 ÷ 700 = 2.6% of registered users.
Do not compare 38.6% with 2.6% as if they measured the same thing. One divides by monthly active users, the other by everyone who ever registered, and registered users include people who are no longer active. The practical lesson is to define the denominator before you set a target: paid share of active users in a month is the useful one for planning.
How to choose a model
Choose from how your product creates value, not from what a competitor does. Work through these questions in order.
- Does value recur? If people get value every week or month (software, content, a service), use a recurring model: subscription, freemium or usage-based. If value is delivered once (a template, a course, a licence), a one-time purchase fits.
- Does cost or value scale with usage? If your costs or the customer's value rise with usage (API calls, messages, storage), usage-based pricing matches the two. If usage is flat, a subscription is simpler to buy and to forecast.
- Can a free tier pay for itself? Freemium works when free users cost little to serve and some become paying users or bring others. If each free user costs real money, test a trial instead.
- Is someone else the buyer? If an advertiser or a counterparty pays while users do not, advertising or a transaction fee is the fit, and you need volume first.
- Where will you collect? Model the fee share of each billing channel before settling on a price.
Many products combine two: a subscription with usage overage, freemium with in-app purchases, or a marketplace with a subscription for sellers. Combine only if you can measure each part separately. For the growth side of this choice see SaaS growth strategy, and for the freemium specifics see the freemium model.
What to measure once you have picked one
Set one primary metric and two checks, measured the same way every month.
| Model | Primary metric | Checks |
|---|---|---|
| Subscription | Monthly churn | Revenue per subscriber, payback on acquisition cost |
| Freemium | Paid share of active users | Time from sign-up to paying, support cost per free user |
| Usage-based | Revenue per active account | Share of accounts whose usage grew, billing disputes |
| Advertising | Ad revenue per daily active user | Impressions per session, fill rate |
| Transaction fee | Net take rate | Orders per buyer, share of repeat buyers |
| In-app purchases | Payer share | Spend per payer, share of revenue from the top payers |
| One-time purchase | Conversion rate | Refund rate, share of buyers who return |
If a recurring model's primary metric slips, check retention first: a slow rise in churn is often visible in cohort retention before it reaches revenue.
Reading monetization in TapCub
TapCub measures what your product earns and who pays; it does not bill, collect payments or chase failed payments. Billing stays in your payment system, and TapCub reads the purchases you send it.
- Send purchases and refunds. On payment success, send a purchase event from your server with order id, amount and currency, and a refund event with the same order id. The order id deduplicates retries.
- Read paying rate and revenue per user. In All-platform analytics › Business › Commerce & revenue, paying rate is buyers ÷ active users in the period, and revenue per user and per buyer are next to it. That is the freemium and in-app purchase metric, computed on active users.
- See repeat buying and lifetime value. The same page shows first buyers, repeat rate (people with at least two purchases ÷ buyers) and lifetime value by first-purchase month, with cumulative revenue per person.
- Check retention for the recurring models. In App analytics › Users › Retention (or the cohort retention in All-platform analytics › Behavior › Behavior analysis), compare cohorts. A falling retention curve warns of churn before revenue falls.
- Know the limit. Subscription renewals, MRR and churn from billing are not a TapCub report; calculate them in your billing system, and use TapCub to see the behaviour behind them.
FAQ
What is a monetization model?
It is how a product turns users or usage into revenue: who pays, for what, and how the amount grows. Common types are subscription, freemium, usage-based, advertising, transaction fees, in-app purchases and one-time purchases.
What is the difference between a monetization model and a revenue model?
A monetization model is the strategy for turning value into revenue, such as freemium; a revenue model is the specific income lines in the accounts, such as subscription fees and ad income. Teams often use the terms interchangeably, so define which one you mean.
Which monetization model is best?
It depends on how your product creates value. Recurring value fits subscription or freemium, usage-driven costs fit usage-based pricing, and a buyer who is not the user fits advertising or transaction fees. Test the key metric of the model you choose before scaling it.
What is a good freemium conversion rate?
It depends on the denominator. Spotify's Premium subscribers were about 38.6% of monthly active users in late 2025, while Dropbox's paying users were at most 2.6% of registered users in late 2024. Decide the denominator first and track your own trend.
How much do app stores take from subscriptions?
Apple's published rates are 30% in the first year of paid service and 15% afterwards, or 15% from the start under its Small Business Program; Google Play's rate for auto-renewing subscriptions is 15%. Check each provider's current terms before pricing.
Sources
- Apple Developer. Auto-renewable subscriptions — 70% of the price to you in the first year of paid service, 85% after one year, and 85% from the start under the Small Business Program. Checked 2026-11-20.
- Google Play Console Help. Service fees — 15% on the first $1M a year and 30% beyond, and 15% on auto-renewing subscriptions. Checked 2026-11-20.
- Stripe. Pricing — 2.9% + 30 cents per successful domestic card transaction. Checked 2026-11-20.
- Spotify. Fourth Quarter 2025 earnings — 751 million monthly active users and 290 million Premium subscribers. Checked 2026-11-20.
- Dropbox. Fourth quarter and fiscal 2024 results — 18.22 million paying users and more than 700 million registered users. Checked 2026-11-20.
Was this article helpful?
We use your answers to fix and expand this page.
Couldn’t send. Please try again in a minute.
Thanks for the feedback. We’ll use it to improve this page.You’ve already sent feedback on this page. Thanks.

Product Analyst
Focuses on event analysis, conversion funnels, and retention, using clear metric definitions and structured analysis to explain product performance.