Try it on your own data
Every report in this article is in the free plan. One snippet for web and apps, up to 10 sites.
Start freeMobile app metrics are the numbers that show whether people arrive, come back, use the app, find it stable and pay. The core set is DAU and MAU with stickiness (DAU ÷ MAU), day-1, day-7 and day-30 retention, crash-free users and sessions, and ARPDAU. This page gives each formula, then calculates one sample app end to end and compares it with a reference average and with Google Play's Android vitals thresholds.
What you will learn
- Compare each metric with something: another cohort, the last release or a store threshold, not a generic list
- Crash-free users is stricter than crash-free sessions; in the sample 98.5% by users vs 99.0% by sessions
- Android vitals flags 1.09% of daily users with a crash; the sample's 1.50% is over that line
Which mobile app metrics matter, and how is each calculated?
Most mobile app metrics reduce to six questions: are people arriving, do they come back, do they use the app often, does it work, do they pay, and what does each cost. This table gives one formula and one reading rule per metric, grouped by lifecycle stage.
| Stage | Metric | Formula | What a change tells you |
|---|---|---|---|
| Acquire | New users | Users seen for the first time in the period (a reinstall is not new) | Whether acquisition is working; read with its source |
| Acquire | Cost per install | Spend ÷ installs | Price of an install, not of a useful user |
| Engage | DAU | Distinct users active on a day | Daily size of the active base |
| Engage | MAU | Distinct users active in the last 30 days | Monthly size of the active base |
| Engage | Stickiness | DAU ÷ MAU | Share of monthly users who show up on a typical day |
| Engage | Sessions per DAU | Sessions ÷ DAU | How often an active user opens the app in a day |
| Retain | Day-1 retention | New users from a cohort active on day 1 ÷ cohort size | Whether the first experience works |
| Retain | Day-7 retention | Active on day 7 ÷ cohort size | Whether the first habit forms |
| Retain | Day-30 retention | Active on day 30 ÷ cohort size | Whether the app has a lasting reason to exist |
| Quality | Crash-free users | 1 − crashed users ÷ active users | Share of people who never hit a crash |
| Quality | Crash-free sessions | 1 − crashed sessions ÷ all sessions | Share of sessions that did not end in a crash |
| Revenue | ARPDAU | Revenue in a day ÷ DAU | Daily revenue per active user |
| Revenue | Paying rate | Paying users ÷ active users | How many active users pay |
The generic list is long; the useful part is knowing what a number is compared with: another cohort, the previous release, or a store threshold. The rest of the page does that for retention, stickiness and stability, with one worked example.
A worked example: one app in one month
Sample data for a small app. These are illustrative, not benchmarks, and the arithmetic is recomputed below.
| Item | Value | Calculation |
|---|---|---|
| Average DAU | 6,000 | |
| MAU | 40,000 | |
| Stickiness | 15% | 6,000 ÷ 40,000 |
| Sessions per day | 12,000 | |
| Sessions per DAU | 2.0 | 12,000 ÷ 6,000 |
| Install cohort | 10,000 new users | |
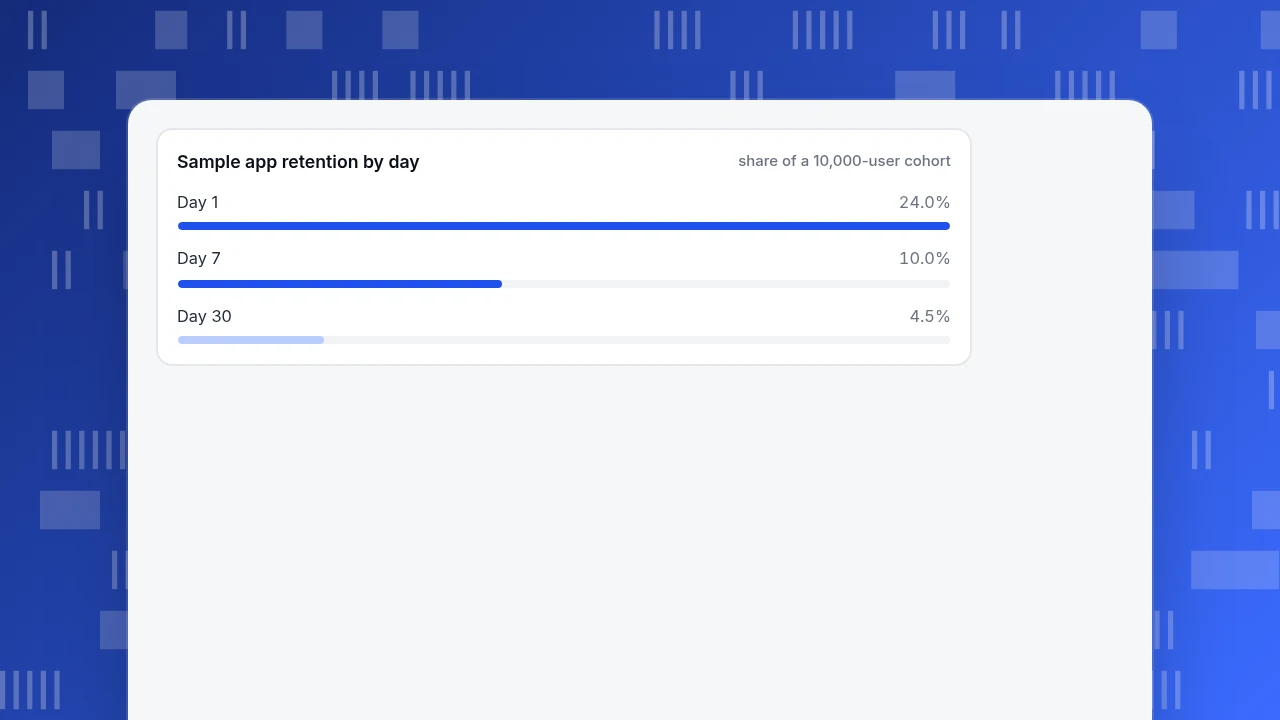
| Day-1 retention | 24.0% | 2,400 ÷ 10,000 |
| Day-7 retention | 10.0% | 1,000 ÷ 10,000 |
| Day-30 retention | 4.5% | 450 ÷ 10,000 |
| Crashed sessions per day | 120 | |
| Crash-free sessions | 99.0% | 1 − 120 ÷ 12,000 |
| Users with a crash per day | 90 | |
| Crash-free users | 98.5% | 1 − 90 ÷ 6,000 |
| Users with an ANR per day | 24 | 24 ÷ 6,000 = 0.40% |
| Revenue per day | $4,500 | |
| ARPDAU | $0.75 | 4,500 ÷ 6,000 |
| Paying users per day | 180 | |
| Paying rate | 3.0% | 180 ÷ 6,000 |
Notice that the same crashes give 99.0% on a session basis and 98.5% on a user basis. A person who opens the app twice a day and crashes once is one crashed user but only half the sessions, so the user figure is the stricter one. Which number a store or a dashboard uses decides whether you look fine or in trouble.
Retention: day 1, day 7 and day 30
Retention asks what share of a group of new users is still active later. Classic retention counts a user on day N only if they were active on day N; "rolling" retention counts anyone active on day N or later, so it is always higher. Check which one a benchmark uses before comparing.
For reference, the Adjust retention glossary lists global averages of about 26% on day 1, 13% on day 7 and 7% on day 30 (the year of the data is not stated there, and averages move by category, platform and year). Against those:
| Day | Our sample | Reference average | Gap |
|---|---|---|---|
| Day 1 | 24.0% | 26% | 2.0 points below (92% of the reference) |
| Day 7 | 10.0% | 13% | 3.0 points below (77%) |
| Day 30 | 4.5% | 7% | 2.5 points below (64%) |
The relative gap widens from day 1 to day 30, which points to a problem with the habit rather than with onboarding. The decision rules:
- Day 1 low: fix the first session. Look at where new users stop in the first screens and at the first value moment.
- Day 1 fine, day 7 low: the app works but nothing brings people back. Look at reminders, content freshness and the second-session experience.
- Day 30 low, curve still falling: there is no stable core of users yet. Look at whether the retention curve flattens; a flat tail at 4% is better than a slope heading to 1%.
- Always split by cohort. Compare the cohort from this release with the previous one, not the whole base with an industry average.
For a deeper walk through formulas and cohorts see retention metrics.
Sample app retention by day
share of a 10,000-user cohortStickiness: what DAU ÷ MAU hides
With 6,000 DAU and 40,000 MAU, stickiness is 15%: on a typical day, 15% of monthly users show up. That is a useful trend line (is it moving up or down?) and a weak comparison across different kinds of apps, because a banking app and a game have different natural frequencies.
Two cautions. Stickiness can rise because users left: if MAU falls faster than DAU, the ratio goes up while the app shrinks. And it says nothing about who is active; split it by new versus returning users before reading anything into it. The DAU/MAU glossary entry has the formula and edge cases.
Stability: crash-free rate and store thresholds
Firebase defines crash-free users as the percentage of users who engaged with the app in a period without a crash, 1 − crashed users ÷ all users, and crash-free sessions as the percentage of sessions that did not end in a crash. Both count only fatal events and are aggregated over the selected period.
On Android there is an external line. Google Play's Android vitals defines overall bad behaviour thresholds: at least 1.09% of daily active users experiencing a user-perceived crash, and at least 0.47% experiencing a user-perceived ANR (application not responding), across all device models. Google says exceeding an overall threshold can reduce a title's visibility across devices, and it lists separate per-device thresholds as well.
Apply that to the sample, remembering that your own measure may not match Google's definition of "user-perceived" and daily active users exactly:
- Users with a crash per day: 90 ÷ 6,000 = 1.50%, above the 1.09% line.
- Users with an ANR per day: 24 ÷ 6,000 = 0.40%, under the 0.47% line, but with little room.
- Crash-free sessions of 99.0% look healthy, which is why the user-based rate is the one to watch against a store threshold.
Decision rule: when the user-based crash rate is above the threshold, group crashes by version and device and fix the top one or two groups first; a few crash types usually account for most affected users.
| Metric | Sample app | Reference |
|---|---|---|
| Day-1 retention | 24.0% | About 26% (Adjust glossary) |
| Day-7 retention | 10.0% | About 13% |
| Day-30 retention | 4.5% | About 7% |
| Users with a crash per day | 1.50% | 1.09% overall line (Android vitals) |
| Users with an ANR per day | 0.40% | 0.47% overall line (Android vitals) |
Sample app data is illustrative; references are averages or store thresholds, not targets.
Revenue and cost metrics, briefly
ARPDAU ($0.75 in the sample) and the paying rate (3.0%) split revenue into "how many pay" and "how much each active user is worth." If ARPDAU rises while the paying rate falls, a few big payers are carrying the number. Cost per install tells you what an install cost, not what a retained user costs: with 4.5% day-30 retention, each retained user costs about 22 times an install (1 ÷ 0.045 = 22.2), a better basis for judging acquisition than the install price alone.
Which five to start with
If you can only instrument a handful, choose by the decision each supports:
- Day-1 and day-7 retention by cohort, for onboarding and habit.
- DAU and MAU with stickiness, as the trend line.
- Crash-free users and sessions, split by version, for release decisions.
- Sessions per DAU, to separate "more users" from "more use."
- ARPDAU and paying rate, if the app earns money.
Define each one in writing (what counts as active, what counts as a session, what a day is) and keep the definitions the same across releases. The full list of options is in mobile app analytics.
Where to see these in TapCub
Take the sample app and read it in TapCub's app reports. TapCub counts what the SDK sends; it does not buy installs.
- Active users. In App analytics › Users › Users, switch between new users, active users, starts, one-time starters and cumulative users. Daily, weekly (7 days) and monthly (30 days) active users are drawn there, and the main daily-active card is the daily average, because adding up a range would count people twice. A reinstall is not a new user.
- Retention. In App analytics › Users › Retention, choose New-user retention (from first day onward) or Active retention, at day, week or month grain. Cells not yet due are marked as not due rather than zero, so a fresh cohort does not look broken.
- Stability. In App analytics › Quality & attribution › Stability, the crash-free share is 1 − crash users ÷ active users, beside crash, ANR and freeze counts, with error groups you can mark active, resolved or ignored. Per-version crash counts are on App analytics › Users › Versions, which answers "did the last release make this worse?"
- Read ANR on its own terms. TapCub shows an ANR as the main thread blocked for at least 5 seconds on Android, which is its own definition and not the same as Google Play's user-perceived ANR, so do not match them one for one.
TapCub does not know your store's ranking rules; the thresholds above come from Google's documentation, and the decision about what to fix stays with you.
FAQ
What are the most important mobile app metrics?
Retention by cohort (day 1, 7 and 30), active users with stickiness, crash-free users and sessions, sessions per active user, and revenue per active user if the app earns money. Choose the ones that support a decision you will actually make.
How do you calculate day-1, day-7 and day-30 retention?
Take a cohort of new users and divide the number still active on day 1, 7 or 30 by the cohort size. For example, 2,400 of 10,000 active on day 1 is 24%. Check whether a benchmark uses classic (exactly day N) or rolling (day N or later) retention.
What is a good DAU/MAU ratio?
There is no universal figure because apps differ in natural frequency. Use it as a trend for your own app, compare cohorts, and watch for the ratio rising only because MAU fell.
What is a good crash-free rate?
For Android, Google Play's overall bad behaviour threshold is 1.09% of daily active users with a user-perceived crash, so a crash-free user rate below about 98.9% on that basis puts you at risk. Measure users, not only sessions, because sessions hide repeat crashes for the same person.
What is the difference between crash-free users and crash-free sessions?
Crash-free users is the share of people who did not crash in the period; crash-free sessions is the share of sessions that did not end in a crash. The user figure is stricter when the same person crashes in several sessions.
Sources
- Google Play Console Help. Android vitals — overall bad behaviour thresholds of 1.09% of daily active users with a user-perceived crash and 0.47% with a user-perceived ANR, and the visibility effect. Checked 2026-11-20.
- Firebase. Crash-free metrics — definitions and formulas for crash-free users and crash-free sessions. Checked 2026-11-20.
- Adjust. Retention rate glossary — global average retention rates of about 26%, 13% and 7% on days 1, 7 and 30 (year not stated). Checked 2026-11-20.
Was this article helpful?
We use your answers to fix and expand this page.
Couldn’t send. Please try again in a minute.
Thanks for the feedback. We’ll use it to improve this page.You’ve already sent feedback on this page. Thanks.

Data Analyst
Explores traffic sources, conversion funnels, and retention, using clear metric definitions and concrete examples to explain what the numbers mean.