Try it on your own data
Every report in this article is in the free plan. One snippet for web and apps, up to 10 sites.
Start freeMobile advertising is paid promotion shown on phones and tablets: banners, interstitials, rewarded video and native ads in apps and mobile web, social app-install ads, push and SMS. You buy it per thousand impressions (CPM), click (CPC), install (CPI) or later action (CPA), and these convert into each other by simple arithmetic. The part that decides success is measurement after the install: below, formats, pricing, Apple's attribution limits and a worked example.
What you will learn
- Convert any quote into cost per install with CPI = CPM / (1,000 x click-through rate x click-to-install rate)
- Treat first-day iOS install numbers as provisional: Apple documents 24 to 48 hours of postback delay and three windows up to day 35
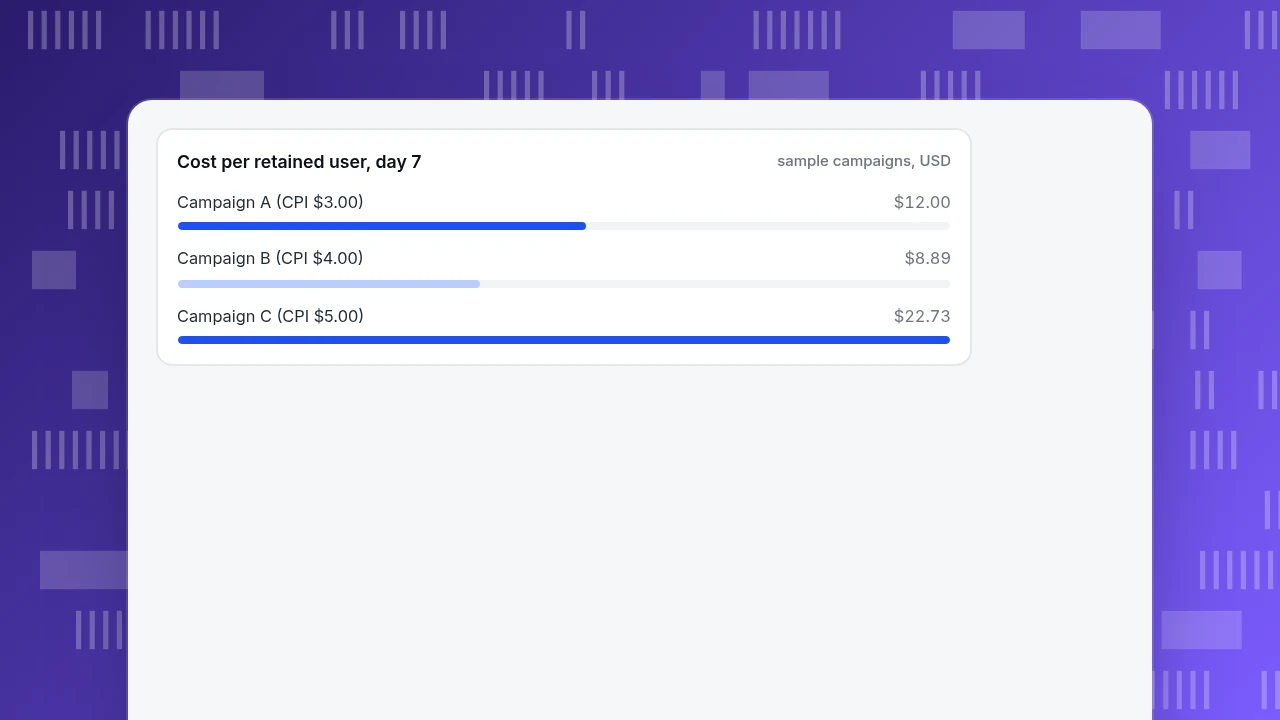
- Rank campaigns by cost per retained user, not cost per install: in the sample, the cheapest install cost 35% more per retained user than the best campaign
What counts as mobile advertising?
Mobile advertising is any paid ad shown on a phone or tablet: inside an app, on a mobile web page, in a social feed, or through a push or SMS message. It is a subset of digital advertising, which is large. The IAB and PwC put US internet advertising revenue at $258.6 billion for 2024, up 14.9% on 2023 (IAB, April 2025), and the audience is already on handsets: 91% of US adults own a smartphone in Pew Research's survey fielded January 30 to June 18, 2026 (Pew Research Center).
Two things make mobile different from desktop advertising, and both shape the rest of this guide:
- The conversion often happens somewhere else. A tap on an ad may lead to an app store page, then an install, then a first launch, then a purchase days later. Each hop is a place where measurement can break.
- The platform controls the data. On iOS, install attribution runs through Apple's own framework, which delays and limits what an advertiser sees (see "How installs are measured" below).
The practical consequence: choosing a format and a buying model is the easy part. Knowing whether the people you paid for stayed and paid is the hard part. The rest of this page is built around that.
Which mobile ad formats are there?
Formats differ in where they appear, how intrusive they are, and which buying model they usually come with. The table lists the common ones; what to watch is a judgement call you should check against your own data.
| Format | Where it appears | Often bought as | What to watch |
|---|---|---|---|
| Banner | A strip at the top or bottom of an app screen or mobile page | CPM or CPC | Accidental taps inflate clicks without installs |
| Interstitial | Full screen between app screens or levels | CPM or CPI | Poor timing annoys users and lowers day-1 retention |
| Rewarded video | Optional video in exchange for an in-app reward | CPM or CPI | Users who came for the reward may not stay |
| Native | Styled like the surrounding content in a feed or list | CPM or CPC | Needs creative that fits each placement |
| Social app-install ad | In a social feed, with a store link | CPC or CPI | Optimisation targets installs, not necessarily good users |
| Push or SMS | The lock screen or messaging app, to existing users | Flat fee or CPM | Opt-in only; frequency drives opt-outs |
Notice the last column. For every format, the thing to watch is a post-install or post-click outcome, not the ad itself. That is why the next two sections separate how you pay from how you judge.
How do pricing models work: CPM, CPC, CPI and CPA?
You can be charged per thousand impressions, per click, per install, or per later action. The models are linked by arithmetic, so you can translate any quote into cost per install and compare.
- CPM (cost per mille): price for 1,000 impressions.
- CPC (cost per click): price for each click.
- CPI (cost per install): price for each install.
- CPA (cost per action): price for a defined later action such as a registration or purchase.
The conversion between them:
CPI = CPM ÷ (1,000 × click-through rate × click-to-install rate)
Sample data: you spend $10,000 at a $5.00 CPM. That buys 10,000 ÷ 5.00 × 1,000 = 2,000,000 impressions. At a 0.8% click-through rate that is 2,000,000 × 0.008 = 16,000 clicks, so the effective CPC is $10,000 ÷ 16,000 = $0.625. If 12% of clicks become installs, you get 16,000 × 0.12 = 1,920 installs, an effective CPI of $10,000 ÷ 1,920 = $5.21. Check with the formula: 5.00 ÷ (1,000 × 0.008 × 0.12) = $5.21.
What this means when you compare quotes:
- A CPM quote carries the delivery risk on you: you pay for the impression whether or not anyone taps.
- A CPC quote moves click-through risk to the seller, but click-to-install risk stays with you.
- A CPI quote moves both to the seller, so the price per install is higher, but it still says nothing about whether the installer opened the app a second time.
No pricing model pays for a retained user unless you define the action that way. That is the case for pricing, or at least judging, on a later event.
| Model | You pay per | Risk you carry | Typical question it answers |
|---|---|---|---|
| CPM | 1,000 impressions | Delivery and click-through | Did the ad reach people? |
| CPC | Click | Click-to-install | Did the creative earn the tap? |
| CPI | Install | Whether installers return | What did an install cost? |
| CPA | Defined later action | Little, if the action is well defined | What did a registration or purchase cost? |
Convert any quote: CPI = CPM / (1,000 x click-through rate x click-to-install rate).
How are installs measured?
An ad platform can report impressions and clicks itself. An install is reported by the app store or an attribution provider, and on iOS the path is set by Apple. Apple's SKAdNetwork documentation describes the privacy-preserving flow; Apple now points new campaigns to AdAttributionKit, which it says covers app ad campaigns on the App Store and alternative marketplaces (Apple, SKAdNetwork). The numbers that matter for planning, from Apple's page on multiple conversion windows (Apple, postbacks):
| Item | What Apple documents |
|---|---|
| Conversion windows | Three: days 0 to 2, days 3 to 7, days 8 to 35, counted from the first app launch |
| Postback delay | 24 to 48 hours after the first window ends; 24 to 144 hours after the second and third |
| Fine conversion value | Available only in the first postback, and only in higher crowd-size tiers |
| Later postbacks | Carry only a coarse value |
| Lowest crowd tier (Tier 0) | Only the first postback is sent, with a two-digit source identifier |
Three planning rules follow:
- Day-1 numbers are never final. The first postback arrives at least a day or two after the first window closes, so a campaign launched Monday may show its first reliable installs late in the week.
- Small campaigns lose detail. Smaller crowds fall into lower tiers and report less. Judge small tests with your own app events, not postbacks alone.
- Retention is outside the postback. Later windows carry a coarse value, not a retention curve. Retention has to come from your own analytics.
Worked example: from cheapest install to cheapest retained user
Sample data: three campaigns, each with $6,000 spend over the same period. Revenue per buyer is $40. Retention is the share of installers who open the app again on day 7 (see app retention rate).
| Campaign | Installs | CPI | Day-7 retention | Retained users | Cost per retained user | Buyers in 30 days | 30-day revenue | 30-day ROAS |
|---|---|---|---|---|---|---|---|---|
| A | 2,000 | $3.00 | 25% | 500 | $12.00 | 70 (3.5%) | $2,800 | 0.47 |
| B | 1,500 | $4.00 | 45% | 675 | $8.89 | 90 (6.0%) | $3,600 | 0.60 |
| C | 1,200 | $5.00 | 22% | 264 | $22.73 | 24 (2.0%) | $960 | 0.16 |
The calculation per row: CPI = spend ÷ installs; retained users = installs × day-7 retention; cost per retained user = spend ÷ retained users (equivalently CPI ÷ retention); ROAS = revenue ÷ spend.
Read it in order:
- A looks best on CPI. At $3.00 it is 25% cheaper than B.
- B is better on every outcome that follows. Its cost per retained user is $8.89 against A's $12.00, a 26% reduction, and it earns $3,600 against $2,800.
- C is worst on both. Its CPI is the highest and fewer than a quarter of its installers return.
- A 30-day ROAS below 1.0 is not automatically a loss. If your payback window is 90 days, you need a retention-based forecast. Decide the window before you launch, not after the numbers arrive.
The lesson: rank campaigns by cost per retained user (or cost per paying user) once those numbers are mature, and use CPI only as an early warning that is cheap to read.
Cost per retained user, day 7
sample campaigns, USDWhich metric answers which question?
Use one table per report so nobody argues about a number's meaning.
| Question | Metric | Formula | Where it comes from |
|---|---|---|---|
| Did the ad get shown? | Impressions | Counted by the ad platform | Ad platform |
| Did the creative earn the tap? | Click-through rate | Clicks ÷ impressions | Ad platform |
| What did an install cost? | CPI | Spend ÷ installs | Attribution postbacks |
| Did installers come back? | Day-7 retention | Users active on day 7 ÷ installers | Your own app analytics |
| What did a good user cost? | Cost per retained user | Spend ÷ retained users | Spend and your analytics |
| Did the spend pay back? | ROAS | Revenue ÷ spend | Spend and your order data |
For the wider list of advertising measures, see KPIs for advertising. Which side of the table you control matters: the first three rows belong to the ad platform and attribution layer; the last three need your own events and your own spend figures.
What should you check before launching a mobile campaign?
- Name the success event. Pick the one in-app event that proves a good user (first purchase, third session, registration complete) and make sure the app sends it.
- Fix the payback window. Write down, for example, "30-day revenue ÷ spend ≥ 0.6, and day-7 retention ≥ 35%" before money moves. Changing the target afterwards turns measurement into storytelling.
- Tag every link you control. If a campaign sends people to a mobile web page, add UTM parameters so the visit is attributed to the campaign, not to "direct".
- Decide the sample you need. If the campaign will deliver only a few hundred installs, expect noisy retention. Wait for enough installers before comparing two campaigns.
- Record spend per campaign per day. Cost per retained user needs spend broken down at the same level as installs.
How to measure mobile advertising results in TapCub
TapCub does not buy, serve or optimise ads, and it does not match a click to an install: it is not an attribution provider. It measures what happens after, from the same data as the rest of your site and app. Here is how the example above would run.
- Tag the mobile web landing links. Put
utm_source,utm_mediumandutm_campaignon every ad destination. In Web analytics › Sources, the UTM tab splits visitors, sessions and pageviews by source, medium and campaign. Visits that carry click IDs such asgclidare treated as paid search by default. - Enter spend per day, channel and campaign. In All-platform analytics › Business › Channel ROI, use the Costs tab to add rows or import a CSV with
day,channel,source,campaign,cost. The ROI tab then shows cost per click (spend ÷ sessions), cost per acquisition (spend ÷ purchases on the order ledger) and return on ad spend (revenue ÷ spend), grouped by channel, source or campaign. - Bring installs in through your attribution provider. Point the provider's install postback at the receive URL on the MMP tab of business settings. Each postback becomes an
$app_installevent with the media source stored, and the Installs tab summarises media source, organic versus non-organic, campaign and platform. - Read retention for the installers. App analytics › Users › Retention shows how many people from a cohort come back on later days, by version and channel, so you can compute cost per retained user as in the table above.
- Know the limits. TapCub does not bid, choose placements or target audiences, and it does not produce Apple's install postbacks; those come from your attribution provider.
FAQ
What is mobile advertising?
Mobile advertising is paid promotion delivered to phones and tablets: banners, interstitials, rewarded video and native ads in apps and mobile web, social app-install ads, and push or SMS messages. It is a subset of digital advertising, and its main measurement challenge is that the click, install and purchase often happen in different places.
What are the main pricing models in mobile advertising?
CPM charges per 1,000 impressions, CPC per click, CPI per install, and CPA per defined later action. They convert into each other with simple arithmetic: CPI equals CPM divided by 1,000 times click-through rate times click-to-install rate. In the sample, a $5.00 CPM became a $5.21 CPI.
What is a good cost per install?
There is no universal figure, because it depends on what an installer is worth to you. Compare cost per install with cost per retained or paying user. In the sample, the campaign with the lowest CPI ($3.00) had a higher cost per retained user ($12.00) than the $4.00 campaign ($8.89).
How does Apple's attribution framework change measurement?
It adds delay and removes detail. Apple documents three conversion windows (days 0 to 2, 3 to 7 and 8 to 35), a first-postback delay of 24 to 48 hours, and coarse values only in later postbacks. Fine-grained values appear only for higher crowd-size tiers, so small campaigns report less.
What is the difference between mobile advertising and mobile marketing?
Mobile advertising is the paid part: you pay for placements. Mobile marketing is wider and includes owned channels such as your app, email and push to existing users. This page covers the paid part, because it is the part where cost and outcome have to be compared.
Sources
- Apple. Receiving postbacks in multiple conversion windows — conversion windows, postback delays, tiers. Checked 2026-11-20.
- Apple. SKAdNetwork — framework overview and the note pointing to AdAttributionKit. Checked 2026-11-20.
- Pew Research Center. Mobile fact sheet — 91% smartphone ownership, survey January 30 to June 18, 2026. Checked 2026-11-20.
- IAB. Digital ad revenue 2024 — $258.6 billion, up 14.9%, released April 17, 2025. Checked 2026-11-20.
Was this article helpful?
We use your answers to fix and expand this page.
Couldn’t send. Please try again in a minute.
Thanks for the feedback. We’ll use it to improve this page.You’ve already sent feedback on this page. Thanks.

Product Experience Specialist
Explores usability, user journeys, and feature adoption through practical examples of onboarding and everyday product use.