Try it on your own data
Every report in this article is in the free plan. One snippet for web and apps, up to 10 sites.
Start freeThe KPIs for advertising are the one primary and two supporting numbers you choose before a campaign to judge it, from three layers: reach (impressions, clicks), action (conversions, cost per acquisition) and result (return, profit). Use the reach layer to diagnose and the result layer to decide, because only the bottom layer says whether spending paid back.
What you will learn
- Pick one primary KPI and two supporting ones before the campaign starts, from the layer that matches its role
- Reach metrics diagnose; judge winners by action and result metrics, with ROAS compared against break-even
- Set a CPA ceiling from average order value × gross margin
What a KPI for advertising is
A KPI (key performance indicator) for advertising is the one number you agree in advance to judge a campaign by, chosen because it reflects the goal of the campaign. Impressions, clicks, conversions and revenue are all measurable; a KPI is the one or two that decide whether the campaign counts as a success. Industry guides agree on the principle that KPIs should come from business objectives rather than from whatever the ad platform shows by default, and they disagree on the list, so the list below is a working set, not a standard.
The reason to choose in advance is that advertising metrics point in different directions. A campaign can be best on cost per click and worst on cost per sale at the same time, and whichever number you look at after the fact will tell the story you want. This guide sorts advertising KPIs into three layers by what they measure, gives the formula for each, and works one example where the layers disagree. It does not repeat the full list of marketing indicators in marketing KPIs or the pay-per-click workflow in PPC analysis.
The three layers: reach, action, result
Every advertising metric measures one of three things. The layers are ordered by distance from the money.
| Layer | What it measures | Metrics | Question it answers |
|---|---|---|---|
| Reach | Whether people saw and clicked the ad | Impressions, reach, frequency, viewable impressions, CPM, click-through rate (CTR), cost per click (CPC) | Is the ad being seen and is it getting attention? |
| Action | Whether people did what you wanted | Conversion rate, cost per acquisition (CPA), average order value | How much does one result cost? |
| Result | Whether the business gained | Return on ad spend (ROAS), gross profit after spend, new-customer share, repeat purchase | Did the spending pay back? |
The rule that follows: use the upper layers to diagnose and the lower layers to decide. CTR and CPC tell you why a result is what it is; they should not be the number you pick winners by. Only the result layer can say a campaign was worth running. The traps are all at the top: a high CTR is easy to buy with a curiosity headline and says nothing about whether those clicks buy.
The formulas
| Metric | Formula | Notes |
|---|---|---|
| Impressions | Number of times the ad was served | Served is not seen |
| Viewable impressions | Impressions that met a visibility standard | For display, the Media Rating Council standard is at least 50% of the ad's pixels in view for at least 1 continuous second (2 seconds for video) |
| Frequency | Impressions ÷ reach | Average times one person saw the ad |
| CPM | Spend ÷ impressions × 1,000 | Cost per thousand impressions |
| CTR | Clicks ÷ impressions | Share of impressions that were clicked |
| CPC | Spend ÷ clicks | Price of a click |
| Conversion rate | Conversions ÷ clicks | Share of clicks that converted |
| CPA | Spend ÷ conversions | Price of a conversion; equals CPC ÷ conversion rate |
| Average order value (AOV) | Revenue ÷ orders | |
| ROAS | Revenue ÷ spend | Google Ads reports it as conversion value per cost |
| Gross profit after spend | Revenue × gross margin − spend | The one that includes what the goods cost |
| Break-even ROAS | 1 ÷ gross margin | At 40% margin, 2.5 |
For definitions of the big three, see cost per click, cost per acquisition and ROI and ROAS. The identity in the CPA row is useful: CPA = CPC ÷ conversion rate, so a campaign with cheap clicks only has a low CPA if its clicks also convert.
Worked example: two campaigns that disagree
Sample data: a store runs two campaigns for a month with the same $5,000 budget each and a 40% gross margin.
| Campaign A (broad video) | Campaign B (search intent) | |
|---|---|---|
| Spend | $5,000 | $5,000 |
| Impressions | 1,000,000 | 400,000 |
| CPM | $5.00 | $12.50 |
| Clicks | 20,000 | 6,000 |
| CTR | 2.0% | 1.5% |
| CPC | $0.25 | $0.83 |
| Conversions (orders) | 100 | 180 |
| Conversion rate | 0.50% | 3.00% |
| CPA | $50.00 | $27.78 |
| Average order value | $60 | $80 |
| Revenue | $6,000 | $14,400 |
| ROAS | 1.20 | 2.88 |
| Gross profit after spend | −$2,600 | +$760 |
How to recompute: CPM = $5,000 ÷ 1,000,000 × 1,000 = $5.00; CPC = $5,000 ÷ 20,000 = $0.25; CPA = $5,000 ÷ 100 = $50; ROAS = $6,000 ÷ $5,000 = 1.20; gross profit after spend = $6,000 × 0.40 − $5,000 = −$2,600. For B: $14,400 × 0.40 − $5,000 = +$760.
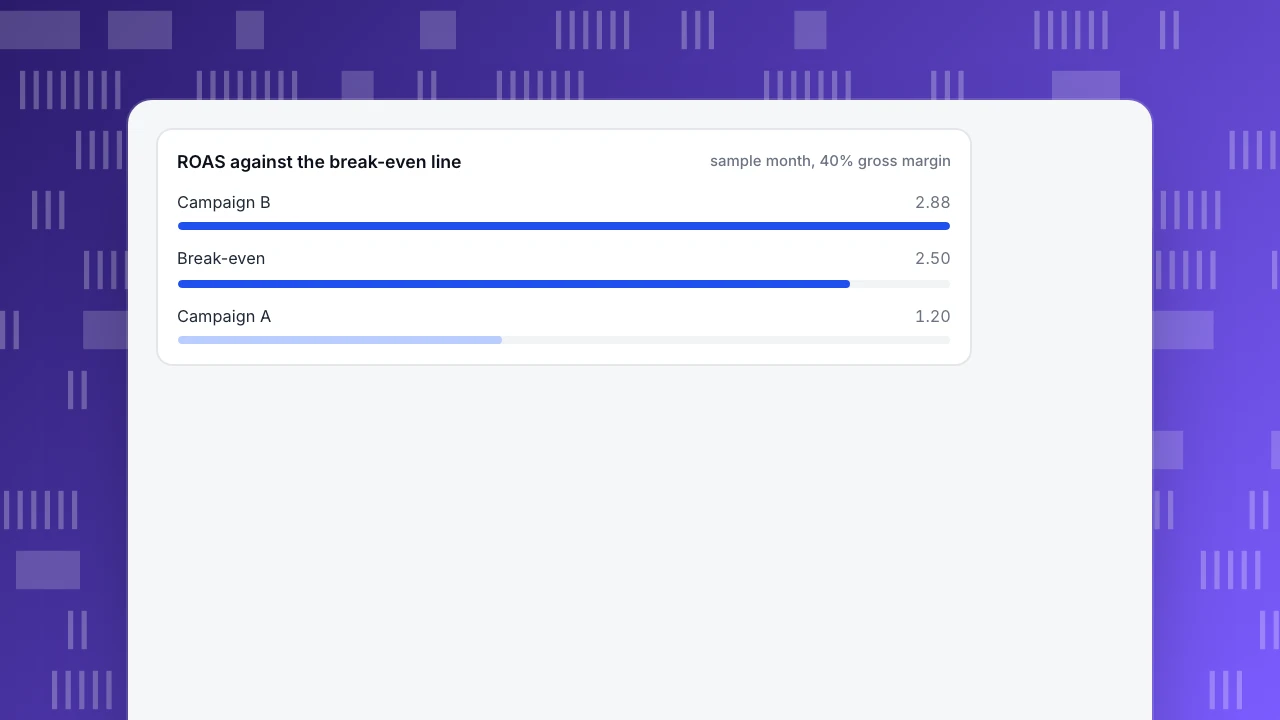
Read the table from the top. Campaign A wins every reach metric: 2.5 times the impressions, a cheaper thousand, a higher CTR and a CPC that is 30% of B's. A report that stops at the top layer would scale A. At the result layer, A loses $2,600 and B earns $760. The break-even ROAS is 1 ÷ 0.40 = 2.5; A is at 1.20 and B at 2.88, so only B clears the line. B's conversion rate (3.0% against 0.5%) is six times higher, which more than makes up for a CPC that is 3.3 times higher.
That does not make A useless. If A is introducing the store to people who later search and buy through B, part of B's result belongs to A, and cutting A could shrink B. The way to find out is to look at paths, not just last clicks, and ideally to pause A in a held-out region. The KPI discipline is: judge each campaign by the layer that matches its role, and say which role beforehand.
ROAS against the break-even line
sample month, 40% gross marginHow to choose a KPI by objective
Pick one primary KPI and two supporting ones, and write them down before the campaign starts.
| Objective | Primary KPI | Supporting KPIs | Warning sign |
|---|---|---|---|
| Awareness | Reach or viewable impressions, with a frequency cap | CPM, frequency | Frequency climbing while reach stays flat |
| Traffic | Landing-page visits that stay | CPC, bounce rate or time on page | Clicks rising, engaged sessions flat |
| Sales or sign-ups | CPA against a ceiling | Conversion rate, AOV | CPA creeping up while CTR holds |
| Profit | Gross profit after spend, or ROAS above break-even | Conversion rate, AOV | Healthy ROAS under a thin margin |
| Retention or loyalty | Repeat purchase or return rate for acquired customers | CPA, ROAS over 90 days | Strong first purchase, no second one |
Setting the ceiling matters. For sales, take the most you can pay for an order: AOV × gross margin = gross profit per order. At $80 and 40%, that is $32; CPA must stay under $32 before any other cost. B's $27.78 passes; A's $50.00 does not. See CAC payback period if the first order does not have to pay back alone.
| Metric | Layer | Use it to |
|---|---|---|
| CPM, frequency | Reach | Check cost of attention and ad fatigue |
| CTR, CPC | Reach | Diagnose creative and targeting |
| Conversion rate | Action | See whether clicks are the right clicks |
| CPA | Action | Compare cost per result against a ceiling |
| ROAS | Result | Compare revenue per dollar with 1 ÷ gross margin |
| Gross profit after spend | Result | Decide whether to scale, hold or stop |
Click-through rate and cost per click explain a result; they should not pick the winner.
Common mistakes with advertising KPIs
- Optimising for CTR. CTR rewards headlines that attract clicks; it does not tell you whether the people buy. Use it to diagnose creative.
- Comparing campaigns with different roles. An awareness campaign and a retargeting campaign should not be ranked on the same ROAS.
- Reading ROAS without margin. The same ROAS of 2.0 is a profit at 80% margin and a loss at 40%.
- Trusting platform-reported conversions. Each platform claims its own conversions and the totals exceed your orders. Reconcile to your own order records.
- Confusing clicks with visits. Platforms count clicks; your analytics counts sessions, and the two differ because of redirects, slow pages, bots and people who leave before the page loads. Compare them and investigate a large gap.
- Ignoring frequency. A reach campaign that shows the same ad to the same 10,000 people nine times is a different campaign from one that reaches 90,000 once.
- Too many KPIs. Ten indicators on a report means nobody knows which one wins. One primary and two supporting is enough.
- Judging too early. Wait for a full buying cycle; a campaign that targets considered purchases looks poor in its first week.
Advertising KPIs in TapCub
TapCub does not buy, serve or optimise ads; it measures what the visits from your ads did on your site. That covers the action and result layers and the part of the reach layer you can see in your own traffic. Impressions, reach, CPM and viewability stay in the ad platform.
- Tag the ads. Add campaign parameters to every ad link so TapCub can attribute sessions to a campaign. Open Web analytics › Sources and check that paid search, paid social and display land in the channels you expect; channel rules can be configured.
- Bring in the spend. Open All-platform analytics › Business › Channel ROI, go to Costs and add spend per row or import a CSV with
day,channel,source,campaignandcost(clicksandimpressionscan be included as optional columns). - Read cost, return and conversions. On the ROI tab, group by campaign. TapCub gives cost per click as spend ÷ sessions (not platform clicks), cost per acquisition as spend ÷ purchases on the order ledger and return on ad spend as revenue ÷ spend. Because it counts sessions rather than clicks, a campaign's cost per click here can be higher than the platform shows; compare the two and treat the gap as a data-quality check. Bots are counted separately and do not enter the sessions.
- Apply your margin and your ceiling. Compare ROAS with 1 ÷ gross margin, and CPA with AOV × margin, both written beside the table; TapCub does not hold your cost of goods.
- Check who assists. In All-platform analytics › Behavior › Behavior analysis, choose attribution and select first-touch, last-touch and linear together; each model gets its own column, so an upper-layer campaign that mainly assists shows up before you cut it.
FAQ
What are the most important KPIs for advertising?
It depends on the objective. For sales, cost per acquisition and return on ad spend, checked against gross margin. For awareness, reach and viewable impressions with a frequency cap. For traffic, cost per click and engaged visits. Choose one primary KPI and two supporting ones before the campaign starts.
What is the difference between a KPI and a metric in advertising?
A metric is any measurable number, such as impressions or clicks. A KPI is the metric, or the few metrics, you have decided in advance to judge success by because they reflect the campaign goal. A campaign has dozens of metrics but only one or two KPIs.
What are the 5 main KPIs of digital advertising?
A common five: click-through rate, cost per click, conversion rate, cost per acquisition and return on ad spend. Together they run from attention to result, which makes them a convenient set. Add gross margin to ROAS and a frequency check on awareness campaigns.
Is ROAS a good KPI for advertising?
It is a useful result-layer KPI, with a condition: it measures revenue, not profit. Divide 1 by your gross margin to get the break-even ROAS and compare. At a 40% margin the line is 2.5, so a ROAS of 2.0 loses money before shipping and fees.
What is a good CTR?
There is no single good CTR. It varies by channel, placement, audience and creative, so compare against your own previous campaigns in the same placement. A rising CTR with a falling conversion rate is a warning, not a success.
See also: What Is an Advertisement? Types, Pricing Models and How Ads Are Measured.
See also: Mobile Advertising: Formats, Pricing Models and Measuring Installs.
See also: What is native advertising? Formats and disclosure rules.
Sources
- Media Rating Council and IAB, MRC Viewable Ad Impression Measurement Guideline (viewable impression thresholds).
- Google Ads Help, About Target ROAS bidding (ROAS as conversion value per cost).
- Google Analytics Help, Get started with attribution (attribution definition and models).
Was this article helpful?
We use your answers to fix and expand this page.
Couldn’t send. Please try again in a minute.
Thanks for the feedback. We’ll use it to improve this page.You’ve already sent feedback on this page. Thanks.

Product Adoption Consultant
Explores customer onboarding, live conversations, and self-service, turning common usage questions into practical guidance and improvements.