Try it on your own data
Every report in this article is in the free plan. One snippet for web and apps, up to 10 sites.
Start freeLanding page optimization tools fall into four types: testing, heatmaps, session replay and form analytics. Each answers a different question, so pick by question, starting with analytics that has a goal and a funnel. Below: which tool fits which problem, the sample size a test needs, a heatmap and a form example, and a sensible order.
What you will learn
- Sort tools by the question they answer: which wins, where they click, what happened, where they quit
- An A/B test for a 4% to 5% lift needs about 6,743 visitors per version; test big changes first
- Start with a goal and a funnel; add heatmaps, replay, forms and testing only when a question needs them
What do landing page optimization tools actually do?
Landing page optimization tools help you find out why a page converts as it does and whether a change improves it. The market sells them as one category, but they answer four different questions, and buying the wrong one is the usual mistake:
| Tool type | The question it answers | What it shows | Where it misleads |
|---|---|---|---|
| Testing | Which version converts better? | Conversion of version A against B | Stopped early, or too little traffic |
| Heatmaps | Where do visitors click and how far do they scroll? | Aggregated clicks, repeated clicks, scroll reach | Averages hide different visitor groups; no "why" |
| Session replay | What happened in this one visit? | A recording of one session | Anecdotes feel like evidence |
| Form analytics | Where do people quit the form? | Drop-off by field | Needs field-level collection; sensitive data |
The thesis of this guide: sort tools by the question, then buy one at a time. A testing tool tells you a result and not a cause; a heatmap or replay suggests a cause and cannot prove it. They work as a loop, as explained in landing page analytics and landing page conversion rate: measure the conversion, find where the drop is, form a hypothesis with a heatmap or replay, test the change, measure again.
Speed checks and plain analytics are the base under all four. Without a conversion goal defined in analytics, none of these tools has anything to improve.
| Tool type | Question it answers | Where it misleads |
|---|---|---|
| Testing | Which version converts better? | Stopped early or too little traffic |
| Heatmaps | Where do visitors click and scroll? | Averages; no 'why' |
| Session replay | What happened in this visit? | Anecdotes feel like evidence |
| Form analytics | Where do people quit the form? | Needs field-level collection |
A testing tool gives a result, not a cause; heatmaps and replay suggest a cause and cannot prove it.
Which tool should you use for which problem?
Start from what you see, not from the feature list:
| What you see | Likely question | Start with |
|---|---|---|
| Conversion is low but you do not know where people drop | Where is the leak? | Analytics funnel, then a heatmap |
| Visitors never reach the sign-up button | Is the call to action seen? | Scroll heatmap |
| Visitors click things that are not links | Is something confusing? | Click heatmap and repeated-click view |
| One field or step seems to lose people | Is the form too long? | Form analytics, then a replay of failures |
| You have two competing page versions | Which is better? | A/B test, with enough traffic |
| A change shipped and numbers moved | Did the change cause it? | Compare periods and annotate the release |
| People bounce on phones only | Is mobile broken? | Heatmap by device, replay of mobile visits |
If you cannot name the question, you do not need a new tool yet; you need a goal and a funnel.
How much traffic does a testing tool need?
A/B testing is the tool people want first and the one that most often fails for lack of traffic. The number you need before starting depends on your baseline conversion and the smallest lift you care about. A standard approximation for a two-sided test at 5% significance and 80% power is:
n per version = (1.96 + 0.84)² × [p1(1 − p1) + p2(1 − p2)] ÷ (p1 − p2)²
Sample data: a landing page converts 4% (p1 = 0.04) and you want to detect a lift to 5% (p2 = 0.05).
- Variance term: 0.04 × 0.96 + 0.05 × 0.95 = 0.0384 + 0.0475 = 0.0859.
- Squared gap: 0.01² = 0.0001.
- n = 7.85 × 0.0859 ÷ 0.0001 ≈ 6,743 visitors per version, so 13,486 in total.
- At 1,500 visitors a week, that is 13,486 ÷ 1,500 ≈ 9 weeks.
Compare a bolder change, 4% to 6%: the gap is 0.02, squared 0.0004; the variance term is 0.0384 + 0.0564 = 0.0948; n = 7.85 × 0.0948 ÷ 0.0004 ≈ 1,861 per version, or about 3,722 in total, which is 2.5 weeks at the same traffic. Two lessons follow. Small expected lifts need far more traffic than most landing pages have, and large changes are testable sooner, so test big changes first. And with 1,500 visitors a week you should not run a test for a 1-point lift at all.
Two rules protect the result. Fix the sample size before you start and do not stop the moment the dashboard looks significant: repeatedly checking a test and stopping when it looks significant makes the reported significance meaningless; peeking ten times at what looks like 1% significance is really about 5%. And change one thing per test so you know what produced the result.
What can a heatmap tell you?
A heatmap aggregates where many visitors clicked or how far they scrolled. It is the cheapest way to check whether the thing you want people to do is seen at all.
Sample data: 1,000 visits to a landing page. The scroll-reach view shows the share of visits that reached each depth:
| Depth | Share of visits that reached it |
|---|---|
| 25% | 86% |
| 50% | 62% |
| 75% | 28% |
| 100% | 11% |
The main button sits at 75% depth, so 28% of visits, 280 people, ever see it. If 4% of those who see it click, that is 11.2 clicks. Move the button to 40% depth, which perhaps 70% of visits reach: 700 people see it, and at the same 4% that is 28 clicks, 2.5 times as many, from the same traffic and no new copy. This is a hypothesis to test, not a result: people who scroll far may be the most interested ones, so the click rate may fall as the audience widens.
Read heatmaps by device. A desktop layout and a phone layout are different pages. Treat repeated clicks on something that is not clickable as a signal of confusion, and look at the ranking of clicked elements rather than at the colours alone.
When is session replay worth it?
Replay shows one visit as it happened. Its strength is explaining a drop that numbers pinpoint: after the funnel shows that visitors leave at the form, watch ten recordings of sessions that stopped there and look for the same behaviour: a field that rejects a valid entry, a button that does not respond on a phone, a validation message that appears off-screen.
Use it narrowly. Pick sessions by a defined cut, such as visitors who reached the form and did not submit, rather than watching at random, and treat what you see as a hypothesis. Replay raises privacy questions: mask text input, exclude pages with payment or health details and tell visitors in your privacy notice. Do not let a few vivid recordings overrule the aggregate numbers.
Where does form analytics help, and what does it need?
Forms are where landing pages lose people quietly. Baymard's research found that checkouts averaged 11.3 form fields in 2024, and that most sites need only 8. That is checkout, not a lead form, but the principle holds: every extra field costs completions.
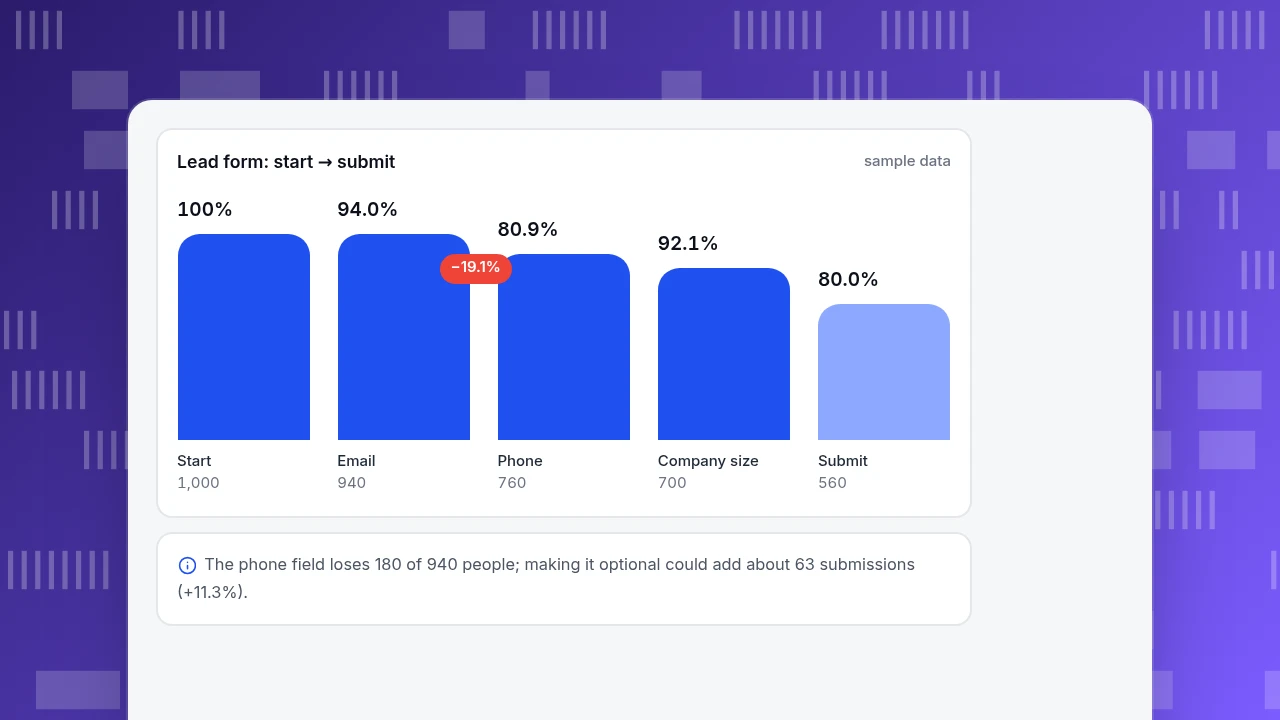
Sample data: 1,000 visitors start a lead form.
| Step | Visitors left | Drop from previous |
|---|---|---|
| Start | 1,000 | |
| 940 | 6.0% | |
| Phone | 760 | 19.1% |
| Company size | 700 | 7.9% |
| Submit | 560 | 20.0% |
Overall completion is 560 ÷ 1,000 = 56%. The phone field loses 180 of 940 people (19.1%). If making it optional cut that loss to 10%, 846 would continue; keeping the later retention rates (700 ÷ 760 and 560 ÷ 700) gives about 779 at company size and 623 submissions, +63, or 11.3%, from one field. The final step also loses 20%: that is the one to watch in a replay.
Field-level analytics needs a tool that collects at field level, which carries the most sensitivity of any tool type. Check what it stores before turning it on.
Lead form: start → submit
sample dataStart
1,000
940
Phone
760
Company size
700
Submit
560
What does a sensible stack look like?
Add tools in this order and stop when the questions are answered:
- Analytics with a goal and a funnel. Without it you cannot tell whether anything worked.
- A speed check on real visits, because a slow landing page loses people before any other tool matters.
- A heatmap on the one or two pages you care about.
- Replay for the specific drop you found.
- Form analytics if a form is the leak.
- A testing tool when the page has the traffic for the sample size above.
What goes wrong when choosing landing page tools?
- Starting with testing on low traffic. The 4% to 5% test above takes about nine weeks at 1,500 visitors a week.
- Stopping a test when it looks significant. Fix the sample size first.
- Reading a heatmap as an explanation. It shows where, not why.
- Letting anecdotes decide. Three vivid recordings are not a sample.
- Buying four tools for one question. Pay for the question you actually have.
- Collecting form content you do not need. More data means more privacy duty.
How do you do this in TapCub?
Take the example landing page with the 56% form completion. TapCub covers the measurement and diagnosis tools; it does not run experiments.
- In Web analytics › Goals, define the conversion (a form-submit event or a thank-you page) and open the page in Web analytics › Pages to see how many visitors reach it.
- In All-platform analytics › Behavior › Behavior analysis, build a funnel of landing page, form start and submit. Each step shows the count, rate against step one, drop-off and median time from the previous step; the largest drop is marked.
- In All-platform analytics › Behavior › Heatmaps, pick the landing page and a device. Clicks, Rage clicks, Scroll reach and Elements correspond to the views above. Turn on Scroll depth in autocapture first, or scroll reach stays empty.
- In All-platform analytics › Behavior › Session replay, open recordings of sessions that reached the form and left. Replay is off by default; enabling it needs an administrator, a privacy notice to visitors and exclusion paths for sensitive pages, and input masking stays on.
- Know the limits. TapCub records form submits as events only when
data-forms="true"is set, and stores only the form's id, name and action, not what people type, so it does not show field-by-field drop-off. It does not run A/B tests or split traffic; run those in a separate testing tool and use TapCub to measure the outcome.
FAQ
What are landing page optimization tools?
They are tools that show why a landing page converts as it does and whether a change helped. They fall into four types: testing, which compares versions; heatmaps, which show clicks and scrolling; session replay, which records single visits; and form analytics, which shows where people quit a form.
Which landing page tool should I start with?
Start with analytics that has a defined goal and a funnel, because it tells you where the loss is. Then use a heatmap on the page that loses people. Add replay for a specific drop and a testing tool only when the page has the traffic for a valid test.
How much traffic do I need for an A/B test?
It depends on your baseline and the lift you want to detect. At a 4% conversion rate, detecting a lift to 5% needs about 6,743 visitors per version at 5% significance and 80% power, while 4% to 6% needs about 1,861. Fix the sample size before starting.
Do heatmaps replace A/B tests?
No. A heatmap shows where visitors click and scroll, which helps form a hypothesis. It cannot show that a change improved conversion. Use it to decide what to test, then test it, or compare periods carefully if you cannot split traffic.
Is session replay a privacy risk?
It can be. Recordings can capture what people see and type, so mask input fields, exclude pages with payment or health information, and describe the recording in your privacy notice. Keep replay narrow: watch sessions from a defined drop rather than recording everything for review.
See also: Overlay Popup Best Practices: Types and Google Rules.
See also: Improving Landing Page Performance: Speed Fixes Ranked by Impact.
Sources
- Evan Miller. How Not To Run an A/B Test: why repeatedly checking and stopping early invalidates reported significance. Verified 2026-11-19.
- Baymard Institute. Checkout form fields: average and recommended: 11.3 average fields in 2024, 8 recommended. Verified 2026-11-19.
- Evan Miller. Sample Size Calculator: sample size per variation from baseline and minimum detectable effect. Verified 2026-11-19.
Was this article helpful?
We use your answers to fix and expand this page.
Couldn’t send. Please try again in a minute.
Thanks for the feedback. We’ll use it to improve this page.You’ve already sent feedback on this page. Thanks.

Product Adoption Consultant
Explores customer onboarding, live conversations, and self-service, turning common usage questions into practical guidance and improvements.