Try it on your own data
Every report in this article is in the free plan. One snippet for web and apps, up to 10 sites.
Start freeImproving landing page performance means getting real visitors to a usable page faster and checking that more of them convert. Diagnose first: web.dev splits LCP into four parts, and in the sample page 1.5 of 4.8 seconds was the hero image being found late. Four fixes then cut LCP to 2.4 seconds in 11 hours, and the work breaks even at a 0.34% conversion uplift, against Vodafone's reported 8% in a randomised test.
What you will learn
- Split LCP into its four parts before fixing anything; the biggest excess is often how late the hero image is discovered
- Rank fixes by seconds saved per hour: in the sample, four fixes cut LCP from 4.8 s to 2.4 s in 11 hours
- Justify the work with a break-even uplift (0.34% in the sample) rather than a borrowed 8%, and verify on real-visitor P75
What "landing page performance" has to mean here
Improving landing page performance means two things measured together: how fast the page becomes usable for real visitors, and what share of them take the action the page exists for. Fixing speed without watching conversion is a guess; watching conversion without fixing the slow part leaves money on the table. This guide ranks fixes by effort and expected effect, and shows how to tell whether the work paid for itself.
Start with the target. Google's web.dev defines Largest Contentful Paint (LCP) as good at 2.5 seconds or less, poor above 4.0 seconds, and says sites should aim for 2.5 seconds or less for at least 75% of page visits. Measure at the 75th percentile, split by mobile and desktop, because averages hide the slow visitors who are most likely to leave.
The conversion evidence is real but narrower than most posts imply. Two documented cases from web.dev:
- Vodafone Italy ran a 50/50 A/B test on paid-channel traffic, about 100,000 clicks and 34,000 visits per day on each version, with the Web Vitals optimization as the only difference. The optimized page had a 31% better LCP (5.7 seconds against 8.3 seconds), and the result was 8% more sales, an 11% higher cart-to-visit rate and a 15% higher lead-to-visit rate (published March 17, 2021).
- Renault analysed real-user data from December 2020 to March 2021 and, by linear regression, estimated a 13% conversion gain for LCP around 1 second and a 14 percentage point lower bounce rate for LCP under 1.6 seconds. The share of visitors with a good LCP in its top five European markets rose from 51% to 73%.
Treat these as direction and order of magnitude, not as a promise. Vodafone's test is the stronger evidence because the traffic was split at random; Renault's is a regression on observational data. Your page, audience and baseline will differ.
Step 1: find out where your LCP time actually goes
A slow LCP has four parts, and the fix depends on which part is large. web.dev's guidance for the ideal split of the total is: time to first byte about 40%, resource load delay under 10%, resource load duration about 40%, and element render delay under 10%. The two delays should be close to zero.
Sample data: a landing page with a P75 LCP of 4.8 seconds, which is in the poor band.
| Part | Seconds | Share of 4.8 s | Ideal share | Verdict |
|---|---|---|---|---|
| Time to first byte | 1.1 | 22.9% | about 40% | Fine, even small |
| Resource load delay | 1.5 | 31.2% | under 10% | Too large: the hero image is found late |
| Resource load duration | 1.6 | 33.3% | about 40% | Heavy file, some room |
| Element render delay | 0.6 | 12.5% | under 10% | Slightly high: blocking scripts |
The arithmetic: 1.1 + 1.5 + 1.6 + 0.6 = 4.8 s, and 1.5 ÷ 4.8 = 31.2%. The biggest excess is not the server and not the image size; it is the 1.5 seconds before the browser even starts downloading the hero image. That is usually because the image is injected by JavaScript, set as a CSS background, or marked for lazy loading. web.dev's advice is blunt: never lazy-load your LCP image.
Notice what the numbers prevent. Without the split, the instinct would be to compress images or buy a faster server. The split says the first fix is something else.
| Part | Seconds | Share of 4.8 s | Ideal share | Verdict |
|---|---|---|---|---|
| Time to first byte | 1.1 | 22.9% | about 40% | Fine, even small |
| Resource load delay | 1.5 | 31.2% | under 10% | Too large: hero image found late |
| Resource load duration | 1.6 | 33.3% | about 40% | Heavy file, some room |
| Element render delay | 0.6 | 12.5% | under 10% | Slightly high: blocking scripts |
Sample data: a landing page with a P75 LCP of 4.8 seconds. Ideal shares are from web.dev's LCP guidance.
Step 2: rank the fixes by seconds saved per hour of work
For each fix, estimate the seconds it should remove and the hours it takes, then divide. Continue the sample page.
Sample data: four fixes, applied in this order.
| Order | Fix | Seconds saved | Hours | Seconds per hour | LCP after |
|---|---|---|---|---|---|
| 1 | Make the hero image discoverable: in the HTML, fetchpriority="high", no lazy loading | 1.2 | 2 | 0.60 | 3.6 s |
| 2 | Compress and resize the hero image, serve a modern format | 0.4 | 2 | 0.20 | 3.2 s |
| 3 | Cache the HTML at a CDN edge, cut redirects | 0.5 | 4 | 0.125 | 2.7 s |
| 4 | Remove or defer render-blocking scripts | 0.3 | 3 | 0.10 | 2.4 s |
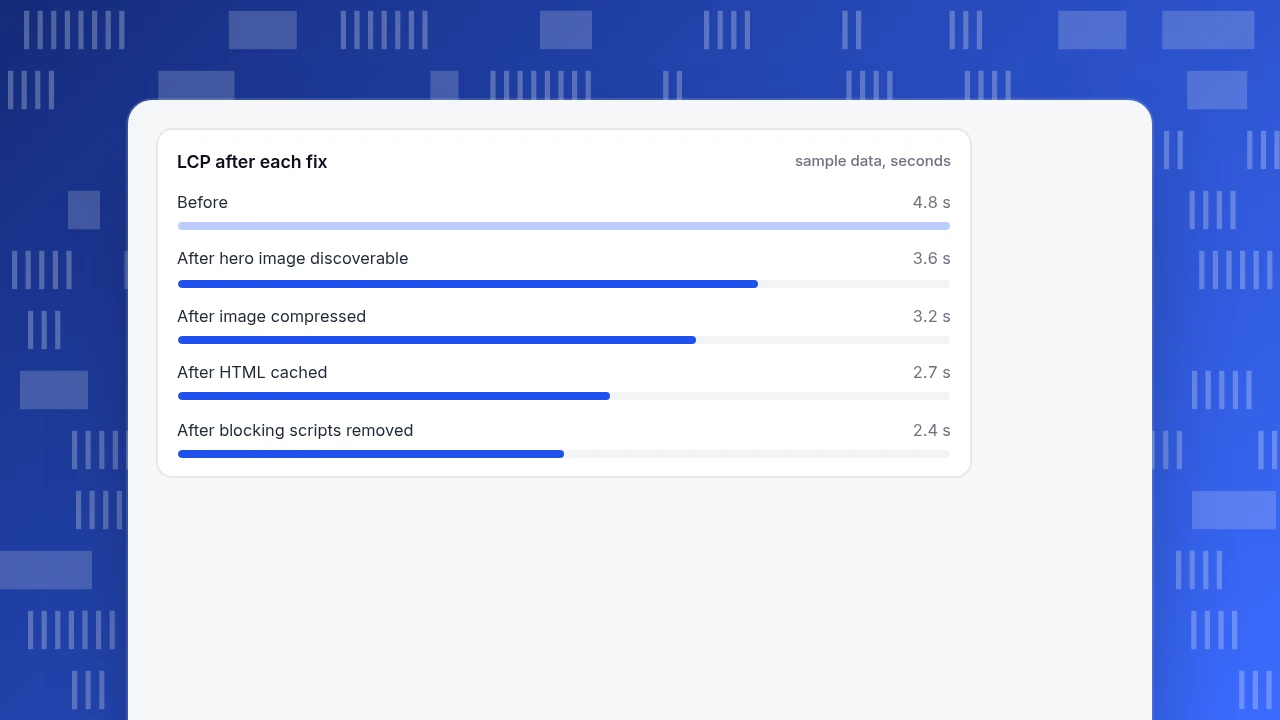
Total: 1.2 + 0.4 + 0.5 + 0.3 = 2.4 seconds saved over 2 + 2 + 4 + 3 = 11 hours, taking LCP from 4.8 s to 2.4 s, just under the 2.5 second target. Fix 1 alone moves the page from poor to needs improvement in two hours. Fix 3 targets time to first byte, which on this page is already under its ideal share, so it earns less per hour.
The effort and savings are estimates for the sample; the method is what to copy. Re-measure after every fix, because optimizing one part can shift time into another without improving LCP, as web.dev warns.
LCP after each fix
sample data, secondsStep 3: decide whether the work pays for itself
You do not need to believe an 8% uplift to justify the work. Compute the break-even uplift instead.
Sample data: 20,000 visits a month, 3.0% conversion, $80 value per conversion.
- Conversions: 20,000 × 3.0% = 600 a month, worth 600 × $80 = $48,000 a month.
- One percent relative uplift (3.00% to 3.03%) adds 6 conversions, or $480 a month.
- Cost of the four fixes: 11 hours × $90 = $990. Spread over six months of benefit, that is $165 a month.
- Break-even: $165 ÷ $48,000 = 0.34% relative uplift in conversion.
The page only has to convert 0.34% better than before for the work to repay itself in six months, against Vodafone's reported 8% under a randomised test. That is a far easier case to make to whoever approves the time, and it holds even if your result is a fifth of Vodafone's. If the page is lower-traffic or lower-value, redo the arithmetic with your numbers; a page with 2,000 visits a month needs ten times the uplift.
Step 4: fixes that are not about speed
Speed is the most measurable lever but not the only one. Other fixes change what visitors see, and their effect depends on your audience, so they need their own test rather than a borrowed percentage:
- Message match. The headline should repeat what the ad or link promised. Check by looking at the entry page for each source and campaign, and compare bounce and conversion between them.
- One primary action. One call to action, repeated, beats several competing ones.
- Form length. Every field you remove costs less than a lead you lose; remove what you do not use in the follow-up.
- Mobile layout. Check the page on a real phone at the width where most of your traffic comes from.
Rank these the same way: estimated effect, hours, then test. How to test and what to track is in landing page conversion rate, and a comparison of tools is in landing page optimization tools. A fair rule: do the speed fixes first because they are verifiable and rarely hurt, then test message and form changes one at a time.
Step 5: check that the fix worked, with real visitors
Lab scores run on one machine; your visitors have many. web.dev specifically recommends measuring from real-user data at the 75th percentile.
- Record the baseline: P75 LCP for the page, mobile and desktop separately, plus conversion rate and bounce rate for visitors who enter on that page.
- Make one change at a time, or at least record the date of each.
- Wait for enough visits that the 75th percentile stabilises. A page with few visits swings widely.
- Compare the same days of the week before and after, because weekends and weekdays differ.
- Check conversion on the same entry page and sources. If LCP improved and conversion did not move, keep the fix (the page is faster) but do not claim the lift.
How to measure landing page performance in TapCub
TapCub shows real-visitor speed next to conversion for the same pages, which is the pairing this guide asks for. It measures and it does not split traffic: the randomised test Vodafone ran needs a separate experimentation tool, as TapCub does not do A/B tests.
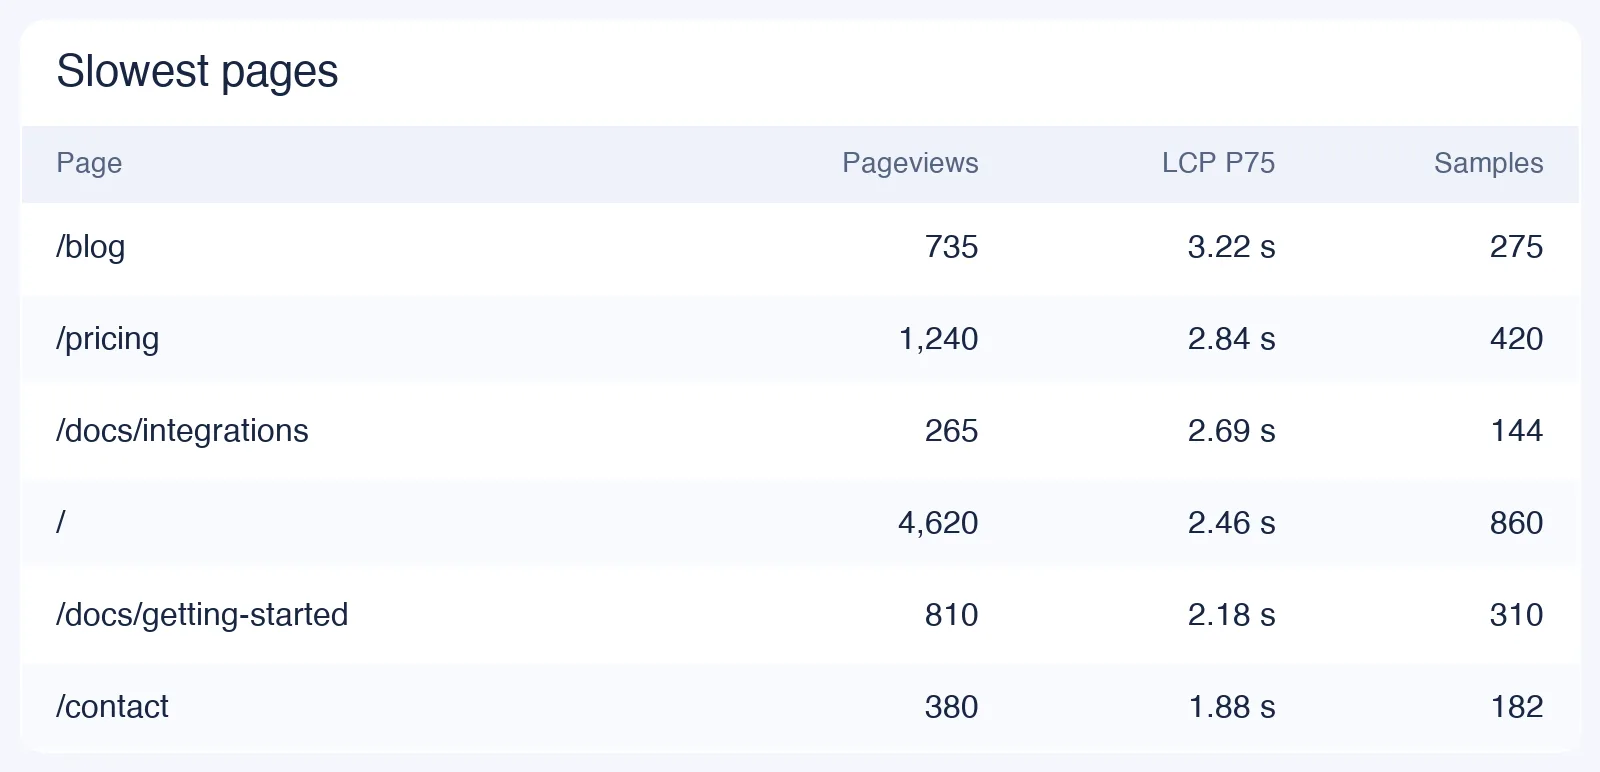
- Find the slow pages. In Monitoring › Performance, cards show LCP against the 2.5 and 4 second thresholds and can switch between P95, P75, median and average. Group by page to see the slowest pages, which are ranked by P75 LCP. A load split shows backend response (time to first byte), network transfer and front-end rendering; it is a three-part view, so it points to the layer but is not the four-part LCP breakdown above. Use Chrome's tools for the LCP parts.
- See whether those pages are leaking. In Web analytics › Pages, the visited pages table gives bounce rate per page and the entry pages tab shows the sessions that start there. Compare your slow pages with the rest.
- Look at the source. Web analytics › Sources shows sessions, bounce and conversion per channel and UTM campaign, so you can see whether paid visitors to the slow page convert worse than organic ones.
- Check the goal. Web analytics › Goals counts the conversion for that page; use it for the before and after.
- Mark the release. Add the date in Configuration › Annotations so the chart explains itself.
Performance numbers come from visitors' browsers: if the script is blocked or outdated, the report is empty rather than estimated, and small samples make percentiles jump. The performance report has no period-over-period comparison, so note the baseline yourself.
FAQ
How do I improve landing page performance?
Measure real-visitor LCP at the 75th percentile, find which of its four parts is too large, fix the part with the most seconds per hour of work (often the hero image being found late), then check conversion on the same entry page. Test non-speed changes separately.
What is a good LCP for a landing page?
Google's web.dev says 2.5 seconds or less is good, over 4.0 seconds is poor, and the target is at least 75% of visits at or below 2.5 seconds, measured separately for mobile and desktop.
Does page speed really affect conversion?
Documented cases say yes. Vodafone's 50/50 test found 8% more sales with a 31% better LCP, and Renault's regression estimated a 13% conversion gain at an LCP around 1 second. Both are specific to those sites, so work out your own break-even uplift.
Which fix gives the biggest speed gain first?
Usually the one that makes the main image or heading start loading earlier. Putting the hero image in the HTML with high fetch priority and removing lazy loading saved 1.2 seconds for 2 hours in the sample, the highest seconds per hour.
How do I know the fix worked and not seasonality?
Compare the same days of the week and the same sources before and after, keep the release date marked, and compare against a similar page you did not change if you have one.
Sources
- web.dev. Largest Contentful Paint: good at 2.5 seconds or less, poor above 4.0 seconds, measured at the 75th percentile. Checked 2026-11-20.
- web.dev. Optimize Largest Contentful Paint: four sub-parts with ideal shares of about 40%, under 10%, about 40% and under 10%; never lazy-load your LCP image. Checked 2026-11-20.
- web.dev. Vodafone: 31% improvement in LCP increased sales by 8%: A/B test numbers, published March 17, 2021. Checked 2026-11-20.
- web.dev. Renault case study: regression estimates for conversion and bounce rate, December 2020 to March 2021. Checked 2026-11-20.
Was this article helpful?
We use your answers to fix and expand this page.
Couldn’t send. Please try again in a minute.
Thanks for the feedback. We’ll use it to improve this page.You’ve already sent feedback on this page. Thanks.

Product Experience Specialist
Writes about product experience, practical workflows, and growth, turning complex processes into clear steps for everyday decisions.