Try it on your own data
Every report in this article is in the free plan. One snippet for web and apps, up to 10 sites.
Start freePPC analysis is the regular review of paid search and social campaigns that decides where the next dollar goes. Most bad PPC conclusions come from two gaps, not from bidding: platform clicks versus on-site sessions, and platform conversions versus on-site goals. Reconcile both first, then compare campaigns on CPC, CPA and ROAS against your break-even line. Below is the full order, worked through one sample month.
What you will learn
- Reconcile before you optimise: never divide a platform number by a site number, and investigate any campaign whose sessions-per-click or conversion ratio is far below the others
- Judge campaigns on site-side CPA and ROAS against a break-even ROAS from your margin (1 ÷ 40% = 2.5 in the example), not against generic benchmarks
- Check landing pages and at least two attribution models before cutting a campaign, then write each decision as a rule with its number
What is PPC analysis, and in what order should you do it?
PPC analysis is the regular review of paid search and paid social campaigns to decide where the next dollar goes: which campaigns get more budget, which keywords get cut, which landing pages need work. It is different from a campaign post-mortem, which looks back at one launch once it ends; that method is covered in marketing campaign analysis. PPC analysis is the weekly and monthly routine that runs while the money is still being spent.
Most guides start with a list of metrics. The order matters more than the list, because each step depends on the one before it:
- Reconcile the ad platform's numbers with your site's numbers. If clicks and sessions, or platform conversions and site goals, disagree by different amounts per campaign, every later comparison is skewed.
- Compare three levels: channel, then campaign, then keyword or ad group. Start broad so a keyword problem does not hide a channel problem.
- Check landing pages. A campaign with healthy click-through but weak conversion is often a page problem, not a bid problem.
- Check attribution. A campaign that looks weak on last click may be starting journeys that other channels close.
- Decide and write it down: raise, hold, cut or fix, with the number that justified it.
The rest of this article walks through each step on one sample month of three search campaigns, so you can recompute every figure.
Step 1: How do you reconcile platform numbers with site numbers?
Two gaps break PPC conclusions more often than any bidding mistake: platform clicks versus on-site sessions, and platform conversions versus on-site goals. Both gaps are normal. The problem starts when you mix the two sources in one calculation, or when the gap is very different from one campaign to the next.
Why clicks and sessions differ is documented by Google itself. Its help article on data discrepancies between Google Ads and Analytics lists, among other causes, that Ads counts clicks while Analytics counts sessions, that Ads filters invalid clicks from its reports, that redirects can stop the analytics code from loading, and that browser settings can block tracking. Google defines invalid clicks as clicks that do not represent genuine interest, such as accidental clicks or clicks from bots and other automated tools, and does not charge for them. Several quick clicks from one person can also become one session.
Conversions differ for other reasons. Google Ads reports a conversion on the date of the ad interaction by default, not the date the conversion happened; it added separate conversions by time columns for the second view. Your site counts the goal on the day it happens. Platforms can also count conversions across devices or after an ad view, which your site cannot see, while your site can miss conversions when tracking is blocked.
Sample data: one month, three Google search campaigns, $10,000 total spend.
| Campaign | Platform clicks | Site sessions | Sessions ÷ clicks | Platform conversions | Site purchases | Site ÷ platform |
|---|---|---|---|---|---|---|
| Brand | 2,400 | 2,280 | 95.0% | 120 | 114 | 95.0% |
| Generic | 7,500 | 6,300 | 84.0% | 168 | 126 | 75.0% |
| Competitor | 2,500 | 1,960 | 78.4% | 34 | 20 | 58.8% |
| Total | 12,400 | 10,540 | 85.0% | 322 | 260 | 80.7% |
The totals look fine: 85% of clicks became sessions, and the site recorded 81% of the conversions the platform claimed. The campaign rows tell a different story. Brand matches almost perfectly; the competitor campaign keeps only 78% of clicks and 59% of conversions. If you judged the campaigns on platform numbers, competitor would look 1.7 times better than it does on site numbers (34 ÷ 20 = 1.7).
Rules for this step:
- Pick one source of record for each decision and never divide a platform number by a site number. Platform CPC is spend ÷ clicks; site-side cost per session is spend ÷ sessions. Both are valid; mixing them is not.
- If sessions ÷ clicks falls below about 80% for one campaign while others sit near 95%, check that campaign's landing page for redirects, slow loading and a missing tag before you touch bids. The threshold is a working rule, not an industry standard; what matters is the spread between campaigns.
- Keep auto-tagging and UTM tags on every ad. Google's auto-tagging appends a click ID (
gclid) to the landing URL so analytics can tie a session to the click. Without it, paid visits can fall into organic or direct. - Remove bots from the site side. If crawler sessions sit in your session count, the clicks-to-sessions ratio and the conversion rate are both wrong.
The table below summarises what each gap usually means and what to check.
| Gap | Platform counts | Site counts | Usual causes | Check first |
|---|---|---|---|---|
| Clicks vs sessions | Billable clicks, invalid clicks removed | Sessions that loaded the tag | Repeat clicks, redirects, slow pages, blocked tracking | Sessions ÷ clicks per campaign; landing page redirects and tag |
| Conversions | Platform-tracked conversions, may include cross-device and view-through | Goals or orders recorded on the site | Different counting rules, blocked tracking, duplicate tags | Site ÷ platform conversions per campaign |
| Conversion date | Date of the ad click by default | Date the goal happened | Conversion lag | Compare by conversion time, or use longer periods |
| Conversion value | Value sent with the platform tag | Order amount in your store or ledger | Currency, tax, refunds, test orders | Revenue per purchase on both sides |
Pick one source of record per decision; the ratios between the two sides matter more than either number alone.
Step 2: How do you compare channel, campaign and keyword?
Once the numbers reconcile, compare top-down. At channel level, ask whether paid search as a whole earns its spend. At campaign level, ask which campaigns carry the result. Only then go to keywords, where samples get small and noise gets loud.
The three ratios that matter, all computed on site numbers:
- Cost per click (site-side) = spend ÷ sessions.
- Cost per acquisition (CPA) = spend ÷ purchases. Definitions are in cost per acquisition; click pricing is in cost per click.
- Return on ad spend (ROAS) = revenue ÷ spend. How ROAS differs from ROI is in ROI vs ROAS.
Sample data, same month:
| Campaign | Spend | Sessions | Purchases | Revenue | Cost per session | CPA | ROAS |
|---|---|---|---|---|---|---|---|
| Brand | $1,200 | 2,280 | 114 | $9,120 | $0.53 | $10.53 | 7.60 |
| Generic | $6,000 | 6,300 | 126 | $11,340 | $0.95 | $47.62 | 1.89 |
| Competitor | $2,800 | 1,960 | 20 | $1,700 | $1.43 | $140.00 | 0.61 |
| Total | $10,000 | 10,540 | 260 | $22,160 | $0.95 | $38.46 | 2.22 |
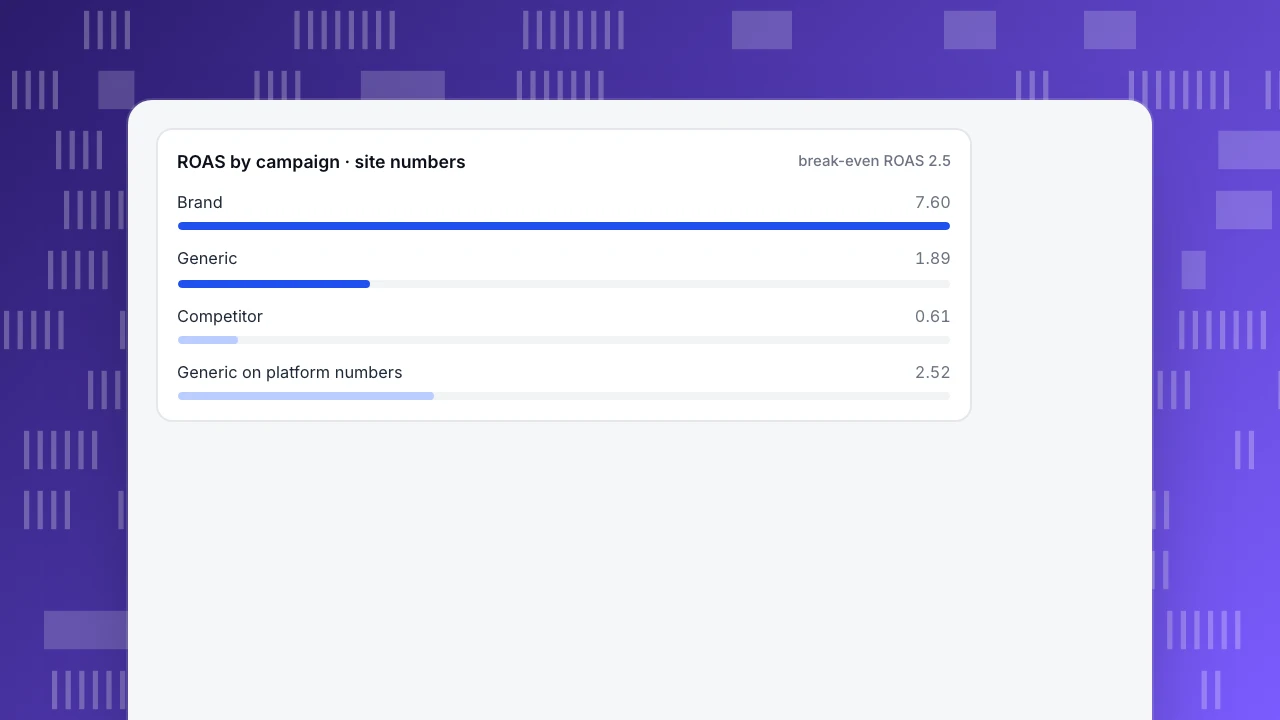
Now add the break-even line. With a 40% gross margin, a sale only pays for its ad cost when ROAS reaches 1 ÷ 0.40 = 2.5. Brand clears it easily. Competitor loses money on every purchase. Generic is the interesting one: on site numbers its ROAS is 1.89, below break-even. On platform numbers, with the platform's 168 conversions at the same $90 average order value, its revenue would be 168 × $90 = $15,120 and its ROAS 15,120 ÷ 6,000 = 2.52, just above break-even.
That is the thesis of this article in one row. The same campaign is profitable or unprofitable depending on which conversion count you used. Before anyone raises the generic budget because the platform shows 2.52, the team has to agree which number is the record, and why the platform sees 42 more conversions than the site (168 − 126).
At keyword level, apply the same ratios but add a floor: do not judge a keyword with fewer than about 10 site conversions or 100 sessions in the period, because one or two orders swing its CPA by half. Group small keywords by theme instead, and look at search terms for wasted spend to block with negative keywords.
ROAS by campaign · site numbers
break-even ROAS 2.5Step 3: What should you check on landing pages?
When a campaign's click-through rate is healthy but its conversion rate is low, the ad has done its job and the page has not. Look at each campaign's landing page conversion rate on site numbers:
- Brand: 114 ÷ 2,280 = 5.0%
- Generic: 126 ÷ 6,300 = 2.0%
- Competitor: 20 ÷ 1,960 = 1.0%
Brand visitors already know you, so a high rate is expected. The generic gap is the one worth working on. If generic traffic converted at 2.5% instead of 2.0%, it would bring 6,300 × 2.5% = 157.5 purchases, about 31 more, and at $90 per order its revenue would reach roughly $14,175, a ROAS of 2.36 on the same spend. Landing page work can move a campaign closer to break-even without changing a single bid.
What to check, in order: does the page match the search intent of the ad group (a "pricing" keyword landing on the homepage is a mismatch), does it load fast on mobile, is the main action visible without scrolling, and does the session count drop sharply on one page compared with its clicks (back to Step 1). Pages with high bounce and short time are candidates; pages with many sessions and almost no goal completions are the first to fix.
Step 4: How do you check attribution before cutting a campaign?
Last-click numbers credit the final visit before the purchase. Generic and competitor search often sit earlier in the journey: a visitor clicks a generic ad, leaves, and comes back a week later through brand search or direct. On last click, generic loses that sale and brand gains it.
Before cutting a campaign, compare at least two attribution models on the same conversions. If generic's credit rises from 126 purchases on last click to, say, 170 under a linear or position-based model, its effective ROAS rises with it (170 × $90 ÷ $6,000 = 2.55). That is an illustration, not a promise: the point is to look before you cut. If credit barely changes across models, the campaign really is weak.
Attribution models still only redistribute observed conversions; none of them proves a campaign caused a sale that would not have happened anyway. Brand search is the classic case: its ROAS of 7.6 includes people who would have found you without the ad. The way to measure that is a holdout or geo test, which belongs to your ad platform or an experiment design, not to a report.
How do you turn the analysis into budget decisions?
Write each decision as a rule with the number that triggered it, so the next review can check whether the rule worked. For the sample month:
- If ROAS is far above break-even and impression share is limited by budget, raise the budget in steps. Brand at 7.6: raise, but test incrementality before assuming all of it is new revenue.
- If ROAS is below break-even on site numbers but above on platform numbers, reconcile before acting. Generic at 1.89 vs 2.52: find the 42-conversion gap first, fix the landing page, then decide.
- If ROAS is below break-even under every attribution model, cut or restructure. Competitor at 0.61: pause it or narrow it to the two or three terms that convert, and move the $2,800 to the campaign with headroom.
- If one campaign keeps a much lower share of clicks as sessions, fix tracking before judging it. Competitor at 78.4% is the lowest; check its landing page first.
- Change one thing per campaign per review cycle. If you change bids, ads and the landing page in the same week, you will not know which change moved the number.
What should a PPC report include?
A useful PPC report is one page, the same structure every time, and starts with decisions rather than charts:
- Decisions this period — what you raised, cut or fixed, and the rule behind each.
- Reconciliation — clicks vs sessions and platform vs site conversions, per campaign, with the ratios.
- Channel and campaign table — spend, sessions, purchases, revenue, cost per session, CPA and ROAS, plus the break-even ROAS line.
- Landing pages — conversion rate per main landing page, with the biggest movers.
- Attribution check — credit under two models for any campaign you plan to cut.
- Next actions — owner and date for each.
Weekly reviews catch broken tracking and runaway spend; monthly reviews are where budget moves, because a week of data rarely has enough conversions per campaign. How to judge return across all marketing, not just paid search, is in marketing ROI. What paid search is and how auctions work is in paid search.
How to run this PPC analysis in TapCub
TapCub does not buy ads, set bids or manage keywords; that stays in Google Ads, Microsoft Ads or Meta. What it does is the site side of the reconciliation, with spend next to it. Here is the sample month in TapCub:
- Import the spend. In All-platform analytics › Business › Channel ROI, open the Costs tab and import a CSV with
day,channel,source,campaignandcost(clicksandimpressionsare optional columns), or add rows one at a time. Re-importing the same day, channel, source and campaign overwrites the row, so a corrected export does not double-count. - Read the site-side ratios. The ROI tab shows cost per click as spend ÷ sessions, cost per acquisition as spend ÷ purchases on the order ledger, and return on ad spend as revenue ÷ spend, grouped by channel, source or campaign. These are the site numbers from Step 2: $0.95 per session for generic, not the platform's $0.80 per click. CPA and ROAS stay empty until purchases are recorded; for a lead-gen site, divide the spend by your lead goal's conversions instead.
- Check the click side. Web analytics › Sources classifies visits that carry
gclid,msclkidand other ad click IDs as paid search even without UTM tags, and lists click IDs in their own table as type and hash (setup notes in track ad click IDs). Bots are counted separately in Web analytics › Bots, so crawler visits do not sit in the sessions you compare with clicks. - Find the landing page problem. In Web analytics › Goals, select the purchase or lead goal and break it down by source and entry page to get the conversion rate per landing page, as in Step 3.
- Compare attribution before you cut. In All-platform analytics › Behavior › Behavior analysis, choose UTM campaign as the touch dimension and select first, last, linear, position-based and time-decay together; each model becomes its own column, so a campaign that only assists stands out.
FAQ
What is included in a PPC analysis?
A PPC analysis reconciles ad platform numbers with site numbers, compares performance at channel, campaign and keyword level, checks landing page conversion, and looks at attribution before any campaign is cut. The core ratios are cost per click, conversion rate, cost per acquisition and return on ad spend, compared against a break-even line derived from your margin rather than against generic benchmarks.
Why don't my Google Ads clicks match my analytics sessions?
Clicks and sessions measure different things. Google filters invalid clicks, several clicks can become one session, redirects or slow pages can stop the tag from loading, and browser settings can block tracking. A gap of a few percent is normal. Investigate when one campaign's sessions-to-clicks ratio is much lower than the others, because that usually points to a landing page or tagging problem.
How do you optimize PPC campaigns?
Reconcile the data first, then move budget toward campaigns whose ROAS clears break-even on site numbers, fix landing pages where click-through is healthy but conversion is low, and add negative keywords for search terms that spend without converting. Change one thing per campaign per cycle and record the rule you used, so the next review can tell whether the change worked.
What should a PPC report include?
Start with the decisions made and the rule behind each, then a reconciliation of clicks vs sessions and platform vs site conversions, a campaign table with spend, sessions, purchases, revenue, CPA and ROAS against break-even, landing page conversion rates, and an attribution check for any campaign you plan to cut. End with next actions, each with an owner and a date.
How often should you analyze PPC campaigns?
Check weekly for broken tracking, runaway spend and sudden drops in sessions per click. Move budget monthly, because most campaigns do not collect enough conversions in a week for a stable CPA. Review attribution and incrementality quarterly, or before any large budget shift, since journeys that start with paid search can take weeks to convert.
See also: KPI for Advertising: Reach, Action and Result Metrics.
See also: PPC Reports: How to Build One From Spend to Sale.
See also: Paid Search Optimization: A Six-Step Weekly Routine With Numbers.
Sources
- Google Analytics Help. Data discrepancies between Google Ads and Analytics — reasons clicks and sessions differ. Verified 2026-11-15.
- Google Ads Help. Invalid clicks: Definition. Verified 2026-11-15.
- Google Ads Help. Understand conversions by time with new columns — interaction date vs conversion date. Verified 2026-11-15.
- Google Ads Help. About auto-tagging — the
gclidclick ID. Verified 2026-11-15.
Was this article helpful?
We use your answers to fix and expand this page.
Couldn’t send. Please try again in a minute.
Thanks for the feedback. We’ll use it to improve this page.You’ve already sent feedback on this page. Thanks.

Product Experience Specialist
Explores usability, user journeys, and feature adoption through practical examples of onboarding and everyday product use.