Try it on your own data
Every report in this article is in the free plan. One snippet for web and apps, up to 10 sites.
Start freeA product launch plan is the working document that takes a product or feature to customers: goals, audience, timeline, owners, rollout and rollback. The part most plans leave vague is judging the result. Write three numbers and an observation window before launch day, mark the launch date on your charts, and review against them.
What you will learn
- Sign off three success metrics, targets and a review window at least three weeks before launch
- Accept the tracking during UAT, record a baseline, and annotate launch day
- A written decision rule turns 23% adoption with 50% repeat use into one clear action
What is a product launch plan?
A product launch plan is the working document that takes a product or feature from "built" to "in customers' hands": who it is for, what the goals are, who does what and when, how it will be rolled out and rolled back, and how the team will judge the result. It is not the product strategy or the roadmap. It is a time-bound plan that turns a decision already made into coordinated work across product, engineering, marketing, sales and support.
Launches come in sizes. A soft launch goes to a small group first, a minimal launch ships quietly with little promotion, and a full launch comes with announcements, campaigns and sales enablement. The plan scales with the size, but every size needs the same core parts.
Most templates are good at the first half: goals, audiences, messaging, channels, a timeline. The part they most often leave vague is the end: how will you know whether the launch worked? This article's position is that the plan should name three numbers and an observation window before launch day, and the launch date should be marked on the charts where those numbers live. Written in advance, the criteria turn a post-launch argument into a decision.
What goes into the plan
A plan that fits on a few pages has seven parts. Each should contain something concrete enough to check later.
- Goal. One sentence that names the change you expect in customer behaviour, written as a product hypothesis: "Teams that export reports manually will schedule them instead, saving a weekly task."
- Audience. Who gets it, in which order: internal users, beta customers, a plan tier, everyone.
- Positioning and message. The problem it solves, in the customer's words, and the one sentence every channel repeats.
- Timeline. Dates working back from launch day, with owners for each task (see the table).
- Roles. One launch owner who can say go or stop, plus named owners for engineering, marketing, support and measurement.
- Success criteria. Three numbers, targets, an observation window and a decision rule (covered in detail below).
- Rollout and rollback. Stages, the signal that pauses a stage, and how to turn the feature off.
The first five parts are well covered by most launch templates. Parts six and seven are where launches go wrong after the announcement has gone out.
Product launch timeline: six weeks before to four weeks after
The table is a timeline for a mid-sized feature launch in a SaaS product. Work back from the launch date; a large launch might start twelve weeks out, a small one three. The point is the order of the work, not the exact week.
Three things in the table are easy to miss:
- Success criteria are signed off three weeks before launch, before anyone has seen a result. Criteria written after launch tend to describe whatever happened.
- The tracking is accepted before the launch, not fixed after it. Two weeks out, user acceptance testing checks that the events fire with the right properties, in the same pass that checks the feature works. The idea is covered in user acceptance testing.
- The review date is fixed in advance. Week four is when the team compares results with the criteria and decides what to do next, whether or not the launch feels like a success.
| When | Product & engineering | Marketing, sales & support | Measurement |
|---|---|---|---|
| Week −6 | Scope, goal written as a hypothesis | Audience and positioning draft | Draft the three success metrics |
| Week −4 | Build; feature flag in place | Messaging, pricing and packaging | Events and properties in the tracking plan |
| Week −3 | Internal release | Help article and FAQ drafts | Criteria, targets and window signed off |
| Week −2 | UAT, including data acceptance | Sales and support training | Baseline recorded for the guardrail |
| Week −1 | Beta rollout to opted-in customers | Announcement and emails scheduled | Dashboard ready; alert set at the stop level |
| Week 0 | General availability | Announcement goes out | Launch date annotated on charts |
| Week +1 | Fix blockers from feedback | Collect and tag launch questions | Daily read of the guardrail |
| Week +2 | Small fixes | Follow-up content for non-adopters | First read of adoption against the plan |
| Week +4 | Decide next step | Share results internally | Review against the criteria |
Work back from the launch date; scale the weeks to the size of the launch.
Write the success criteria before launch
Good criteria have four parts: the metrics, a target for each, the window in which they are measured, and what you will do for each outcome.
Pick three numbers. One is too few, because a single number can rise for the wrong reason. Ten is too many, because something will always be up and something down. A useful set is:
- An adoption metric: the share of the target audience that uses the feature at least once. For the formulas and variants, see feature adoption.
- A value metric: something that shows the feature was worth using again, such as repeat use or a downstream outcome.
- A guardrail: something that must not get worse, such as error rate, page speed or support contacts.
Set the window. Pick the period over which the numbers are judged: four weeks for a feature used weekly, a full billing cycle for something tied to invoices. Do not read the result on day three and call it.
Write the decision rule. For each likely outcome, write the next action. The worked example below shows why this matters more than the targets themselves.
A template that fits on one card:
Within 4 weeks of general availability: (1) at least 25% of weekly active users schedule a report at least once; (2) at least 40% of adopters use scheduling in two or more different weeks; (3) error rate on report pages stays at or below 0.60% (baseline 0.40%). If (1) is missed but (2) is met, fix discoverability. If (2) is missed, revisit the value. If (3) is breached, pause the rollout.
Instrument and accept the tracking before launch
The criteria are useless if the events behind them are missing on launch day. Treat measurement as part of the feature:
- List the events in a tracking plan four weeks out: the event that marks use (for example
report_scheduled), its properties (schedule frequency, report type) and the events your guardrail needs. - Mark required properties. An adoption number broken down by plan is impossible if half the events arrive without the plan property.
- Accept the data during UAT. Run the acceptance scenarios and confirm each event arrives once, with complete required properties, on every platform you ship to.
- Record a baseline. Note the guardrail values for the four weeks before launch. Without a baseline, "error rate 0.45%" means nothing.
- Prepare the dashboard before launch day. Put the three numbers on one board; product adoption dashboards covers the layout.
Roll out in stages, and plan the rollback
A staged rollout limits the damage of a bad release and gives the success metrics a first, small read. Google's SRE workbook describes canarying as a partial, time-limited deployment of a change followed by an evaluation that decides whether the rollout continues, and advises picking a small number of metrics that indicate real user-facing problems, comparing the canary with a control group rather than looking at aggregates. A product launch can borrow the same logic, using a canary release or a beta group as the first stage.
Write the stages and the stop signals into the plan:
| Stage | Who | How long | Pause if |
|---|---|---|---|
| Internal | Your own team | 1 week | Any data-loss or security bug |
| Beta | 5–10% of customers who opted in | 1–2 weeks | Guardrail above its limit for a full day |
| General availability | Everyone in the target plans | Launch day onward | Guardrail above its limit, or a spike in support contacts about the feature |
Two more rules:
- Rollback must be possible in minutes. A feature flag or configuration switch that turns the feature off is part of the release, not an emergency project.
- Count failed launches honestly. DORA's software delivery metrics include change fail rate: the share of deployments that need urgent follow-up such as a rollback or hotfix. Tracking it across launches shows whether your release process is getting safer.
Google's SRE book also publishes a launch coordination checklist that covers architecture, capacity, failover, monitoring, security, external dependencies and rollout planning. For an engineering-heavy launch, use it as the technical half of the plan.
Launch day: mark it and watch it
On launch day, three small actions save hours later:
- Annotate the date on your analytics charts. Months later, when someone asks why weekly active users moved in November, the line on the chart answers.
- Turn on alerts for the guardrail, not a person refreshing a dashboard. A threshold alert on error rate set at your stop level does the watching.
- Route launch questions to one place. Support and sales should know where to send bugs and feedback, and tag those contacts so you can count them.
Post-launch review: a worked example
Sample data: a SaaS product with 8,000 weekly active users launches report scheduling, using the criteria written above.
| Week after launch | Adopters (cumulative) | Adoption rate | Plan's expected path |
|---|---|---|---|
| 1 | 1,120 | 14.0% | 12% |
| 2 | 1,520 | 19.0% | 18% |
| 3 | 1,720 | 21.5% | 22% |
| 4 | 1,840 | 23.0% | 25% |
Adoption rate = adopters ÷ 8,000 weekly active users at launch. At week four:
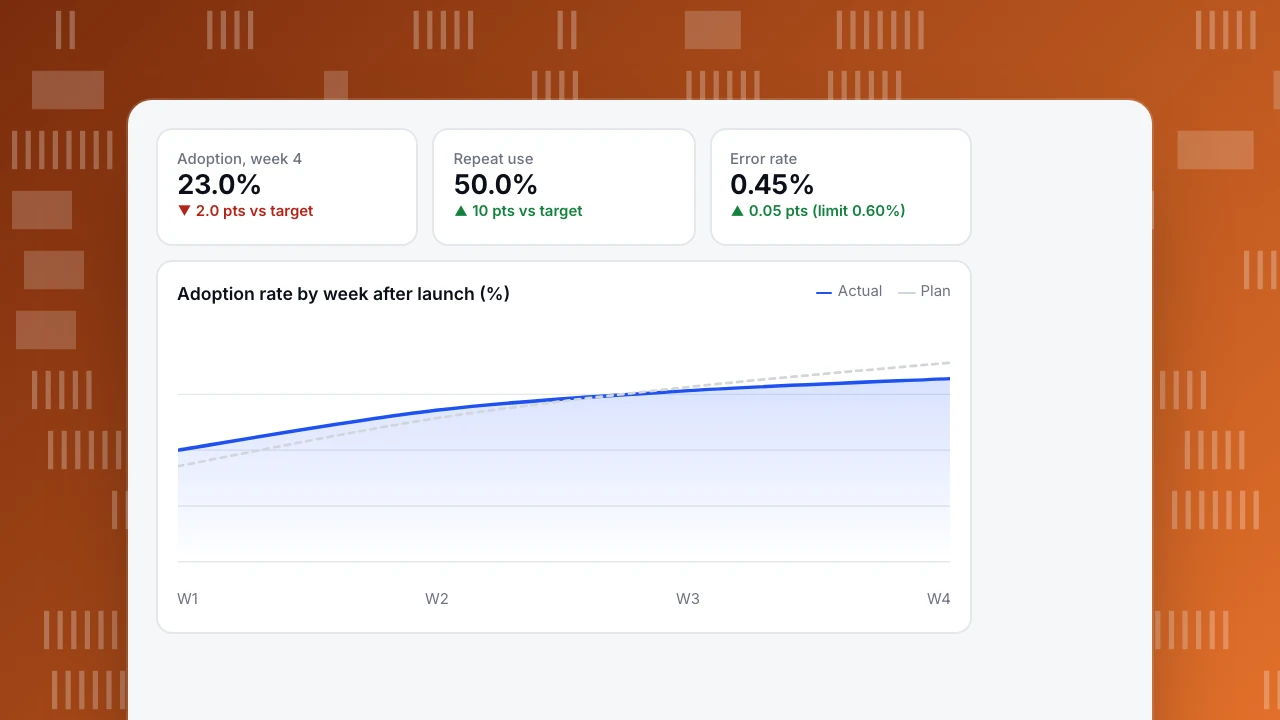
- Adoption: 1,840 ÷ 8,000 = 23.0%, against a target of 25%. Missed by 2.0 points, which is 160 users.
- Repeat use: 920 of the 1,840 adopters used scheduling in two or more different weeks: 920 ÷ 1,840 = 50.0%, against a target of 40%. Met.
- Guardrail: error rate on report pages 0.45%, against a limit of 0.60% and a baseline of 0.40%. Met.
Without written criteria, this launch would produce two opposite stories. "1,840 people used it in the first month" sounds like a hit; "fewer than a quarter of users tried it" sounds like a miss. The decision rule settles it: adoption missed, repeat use met, so the problem is discoverability, not value. People who find the feature come back to it. The next action is specific: add an entry point on the report page where manual exports happen, mention scheduling in the export confirmation, and re-read adoption four weeks later with the same definition.
The curve adds one more clue. The launch ran ahead of plan in weeks one and two, when the announcement was fresh, then flattened. That pattern is common: the announcement reaches people who read announcements. The rest find a feature only where they already work.
Adoption, week 4
23.0%
▼ 2.0 pts vs target
Repeat use
50.0%
▲ 10 pts vs target
Error rate
0.45%
▲ 0.05 pts (limit 0.60%)
Adoption rate by week after launch (%)
ActualPlanCommon launch plan mistakes
- No success criteria, or criteria written after launch. You will measure whatever looks good.
- Vanity numbers as goals. Page views of the announcement post measure the announcement, not the feature.
- Events added after launch day. The first weeks, often the most interesting, are lost.
- No baseline for the guardrail. A change cannot be judged without the value before it.
- No rollback path. If turning the feature off needs a new release, a bad launch lasts days.
- No review date. Without one, the launch is never formally judged and the team moves on without learning. For a longer view of how adoption develops after launch, see how to measure product adoption.
How to track a launch in TapCub
Here is the report scheduling example in TapCub, from planning the events to the week-four review.
- Register the events before release. In All-platform analytics › Data › Tracking plan, add
report_scheduledwith its properties, mark the required ones, and set the status to Proposed, then Developing. During acceptance, turn on Live verification (24 h) to see how many times each event arrived in the last 24 hours and how complete the required properties are, then move it to Accepting and Live. Guide: create a tracking plan. - Define the adoption number once. In All-platform analytics › Behavior › Metrics & SQL, save a custom metric for
report_scheduledusing unique users or the active percent aggregation, so everyone reads the same 23.0% instead of three slightly different versions. - Annotate launch day. In Configuration › Annotations, add a single-day annotation of type Release. It draws a dashed line on trend charts such as Web analytics › Overview and on dashboard trend cards. See add chart annotations.
- Let a monitor watch the guardrail. In All-platform analytics › Operations › Monitors, create a monitor on the built-in
error_ratewith a fixed threshold of 0.60%. A dry run calculates without sending and shows how many times it would have fired in the last 30 days. Monitors notify; they do not roll anything back. - Review against the criteria. At week four, use a segment of people who did
report_scheduledas a cohort in retention in All-platform analytics › Behavior › Behavior analysis to read repeat use, and compare with the targets you wrote.
TapCub measures the launch; it does not provide feature flags or A/B testing. Run staged rollouts and kill switches in your own release tooling.
FAQ
What should a product launch plan include?
A goal written as a hypothesis, the audience and rollout order, positioning and message, a timeline with owners, named roles, success criteria (three metrics, targets, a window and a decision rule) and a rollout and rollback plan. Most templates cover the first five; the last two are where launches most often go wrong.
How far in advance should you plan a product launch?
For a mid-sized feature, about six weeks before launch day, with a review four weeks after. Large launches with pricing changes, partners or press may need twelve weeks or more; a small improvement can work with three. Build the timeline backwards from the launch date and keep the order of the work fixed.
How do you measure product launch success?
Write three numbers before launch: an adoption metric, a value metric such as repeat use, and a guardrail such as error rate. Give each a target, set an observation window, and decide in advance what you will do for each outcome. Then mark the launch date on your charts and review at the end of the window.
What are the phases of a product launch?
Usually three: pre-launch (planning, building, instrumentation, testing and enablement), launch (staged rollout, announcement and close monitoring) and post-launch (measuring against the criteria, fixing what the numbers show and the review). A staged rollout often splits launch into internal, beta and general availability.
What is a product launch timeline?
It is the dated sequence of tasks that leads to launch day and the review after it, with an owner for each task. A common shape runs from six weeks before launch to four weeks after: goals and criteria first, then tracking and testing, then enablement and rollout, then measurement and review.
See also: Product Launch Email: Three-Email Sequence and Benchmarks.
Sources
- Google, Site Reliability Engineering Workbook, Canarying Releases. Checked 2026-11-15.
- Google, Site Reliability Engineering, Appendix E: Launch Coordination Checklist. Checked 2026-11-15.
- DORA, DORA's software delivery performance metrics (change fail rate). Checked 2026-11-15.
Was this article helpful?
We use your answers to fix and expand this page.
Couldn’t send. Please try again in a minute.
Thanks for the feedback. We’ll use it to improve this page.You’ve already sent feedback on this page. Thanks.

Product Adoption Consultant
Explores customer onboarding, live conversations, and self-service, turning common usage questions into practical guidance and improvements.