Try it on your own data
Every report in this article is in the free plan. One snippet for web and apps, up to 10 sites.
Start freeA re-engagement campaign is outreach to customers or users who have gone quiet, meant to bring them back before they leave for good. Its first step is defining dormant from your product's natural usage cycle. Pick the wrong window and you will message people who were coming back anyway, then count their return as success.
What you will learn
- Set the dormant window where about 90% of returns have already happened
- Keep a random holdout: in the sample, a 14-day window overstated results 30 times, a 60-day window 3 times
- Judge the campaign by incremental returns and retention after return, not opens
What is a re-engagement campaign?
A re-engagement campaign is planned outreach to customers or users who have stopped buying, visiting or opening, with the goal of bringing them back before they are gone for good. Email is the usual channel, but push notifications, in-app messages, paid retargeting and a personal call from an account manager are all re-engagement too. Marketers also call it a win-back or reactivation campaign; the words differ, the job is the same.
It sits after churn prevention in the customer lifecycle. Churn prevention works on people who are still active but slipping, and is covered in churn prevention. Re-engagement works on people who have already gone quiet.
Most advice starts with the message: the subject line, the discount, the "we miss you" email. This article starts one step earlier, because the step most campaigns skip decides whether the rest works. Before you write anything, define "dormant" from your product's natural usage cycle. A daily habit app and a yearly tax tool differ by a factor of 50 in how long a normal gap between visits is. Pick the wrong window and you spend the campaign on people who were coming back anyway, then count their return as your success.
Define "dormant" from your product's natural cycle
The right window is not a round number from a blog post. It comes from your own data: how long do customers who come back usually take to come back?
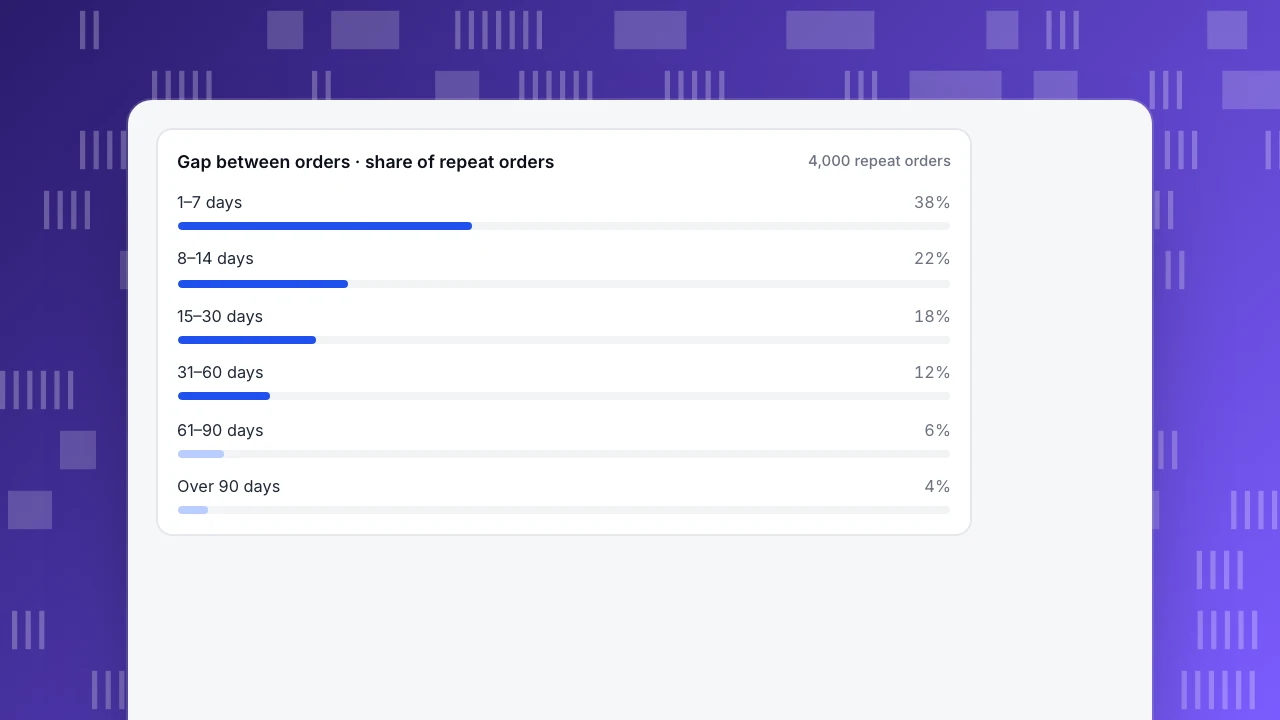
Take every return in a recent period (a repeat order, or an active day after a gap) and measure the gap since the previous one. Then see what share of returns happen within each gap. Sample data: 4,000 repeat orders at a grocery delivery store.
| Gap since previous order | Repeat orders | Share | Cumulative share |
|---|---|---|---|
| 1–7 days | 1,520 | 38% | 38% |
| 8–14 days | 880 | 22% | 60% |
| 15–30 days | 720 | 18% | 78% |
| 31–60 days | 480 | 12% | 90% |
| 61–90 days | 240 | 6% | 96% |
| Over 90 days | 160 | 4% | 100% |
A practical rule: set the dormant window where about 90% of returns have already happened. Here that is 60 days. A customer quiet for 60 days is unusual for this store; only one return in ten comes after that point. A customer quiet for 14 days is not: 40% of all returns happen after day 14.
The same method gives very different answers for different products:
- A daily habit app might see 90% of returns within 3 days, so dormant starts around day 7.
- A grocery or meal-kit store like the sample lands around 60 days.
- A furniture store or a yearly tool such as tax software may need a full year or more, and a "re-engagement" email after 30 days of silence is just noise.
If your distribution has a long tail, use the cumulative share rather than the average gap; one customer who returns after two years drags the average far more than the shape of the curve. This is the same behaviour-based thinking behind behavioral segmentation: define the group by what people did and when, as a rule you can recompute.
Gap between orders · share of repeat orders
4,000 repeat ordersWhy the wrong window wastes the campaign
Sample data: the store runs the same campaign twice, once with a 14-day window and once with a 60-day window. In both, a random 10% of the audience is held out and gets nothing. Returns are measured over 30 days.
| 14-day window | 60-day window | |
|---|---|---|
| Audience | 9,000 | 3,000 |
| Messaged / held out | 8,100 / 900 | 2,700 / 300 |
| Returned, messaged group | 2,430 (30.0%) | 324 (12.0%) |
| Returned, holdout | 261 (29.0%) | 24 (8.0%) |
| Difference | 1.0 point | 4.0 points |
| Incremental returns (difference × messaged) | 81 | 108 |
| Reported "reactivated" ÷ incremental | 30× | 3× |
The 14-day campaign looks like a triumph in a report that counts returns: 2,430 customers came back. But 29% of the people who got nothing came back too. The campaign added one point, about 81 customers, and that difference is smaller than its own noise. The standard error of the difference is about 1.6 points, so the 95% interval runs from −2.1 to +4.1 points and includes zero.
The 60-day campaign reached a third as many people and produced more real returns: 108. Its difference of 4.0 points has a standard error of about 1.7 points, so the 95% interval of +0.7 to +7.3 points stays above zero. The report still overstates it three times (324 ÷ 108), which is why the holdout matters even when the window is right.
Tier the dormant audience
Not everyone past the window is the same. Split them by how long they have been quiet and how valuable they were, because the right message and the point at which to stop both differ. The table shows a tiering for the sample store's 60-day cycle; scale the day counts to your own.
Two rules keep tiers useful:
- Use value as a second axis. A customer with ten past orders who has been quiet for 90 days deserves a personal note; someone with one discounted first order may not deserve any incentive at all. RFM scoring does this with recency, frequency and monetary value; see RFM.
- Give every tier an exit. People who do not respond after the last message move to a suppressed list. Sending to them for months hurts deliverability and annoys the people you most need to win back later.
| Tier | Rule (60-day cycle) | What to send | Stop when |
|---|---|---|---|
| Cooling | Last order 45–60 days ago | A useful reminder, no discount | They order, or reach 60 days |
| Dormant | 61–90 days | What is new; an offer only for high-value customers | Two messages without a response |
| Long dormant | 91–180 days | One message asking whether to keep in touch | One message without a response |
| Lost | Over 180 days | Nothing promotional; keep order and account emails | — |
| High value, any tier | 5+ past orders | A personal note from a person | They reply or say no |
Scale the day counts to your own return distribution; the 60-day window comes from the sample store.
Pick channels and messages
Choose the channel by where the person still is, and the message by why they likely left.
| Likely reason for leaving | What to send | Channel that fits |
|---|---|---|
| Forgot or got busy | A reminder of what they used, with one click back | Email, push |
| Something changed in their need | What is new since they left | Email, in-app on next visit |
| Price | A time-limited offer for high-value tiers only | |
| Bad experience | An apology and a direct line to a person | Personal email from support |
| Moved to a competitor | A short survey or nothing | Email, once |
Email has rules of its own. Google's sender guidelines require every sender to keep the spam rate reported in Postmaster Tools below 0.30% (and suggest staying below 0.10%), require bulk senders of more than 5,000 messages a day to Gmail accounts to support one-click unsubscribe, and suggest considering unsubscribing recipients who don't open or read your messages. A re-engagement campaign is the polite way to do that: ask, then stop.
Do not judge the campaign by opens. Apple's Mail Privacy Protection is designed to stop senders learning about a person's Mail activity, and with it on, Mail downloads remote content, including tracking pixels, in the background by default, so an "open" may not mean a person read anything. Measure the action that matters, such as a return visit, an active day or an order, in your analytics.
Design the holdout
A holdout is the only way to know how many of the returns the campaign caused. Setting it up takes four decisions:
- Random, not convenient. Assign people to holdout by a random bucket, not by "the ones without an email address" or "the last 10% of the list". Any rule that correlates with behaviour biases the comparison.
- Big enough. With a holdout of 300 and a return rate near 8%, the holdout's own rate has a standard error of about 1.6 points. If you expect a lift of only one or two points, you need a larger holdout or a larger audience.
- Same timing. Both groups enter at the same moment and are measured over the same window, such as 30 days after the first send.
- Kept out of everything. If holdout members still get the same offer through push or ads, the comparison measures nothing. Exclude them from every channel in the campaign.
The difference between the groups is the incrementality of the campaign. Report that number, not the raw count of returns.
Measure what comes after the return
A return visit is a start, not the finish. Track three things for the messaged group and the holdout side by side:
- Incremental return rate: messaged return rate − holdout return rate. In the sample, 12.0% − 8.0% = 4.0 points.
- Retention after return: of the people who came back, how many are still active 30 and 60 days later. If returned customers fall away again within a month, the offer bought one order, not a customer. Read this with your normal retention curves.
- Cost per incremental return: campaign cost ÷ incremental returns. If the 60-day campaign cost $1,350 including discounts, that is $1,350 ÷ 108 = $12.50 per customer it actually brought back, not the $1,350 ÷ 324 = $4.17 a returns-only report would show.
Over time, the people who never respond tell you something too. If a whole segment ignores every message, the reason may be in the product, and customer churn prediction can help you spot that segment earlier next time.
Common re-engagement mistakes
- A round-number window. "30 days inactive" is right for some products and absurd for others. Use your return distribution.
- No holdout. Without one, every return looks like a success and you cannot tell a good campaign from a calendar effect.
- Discounts for everyone. Offers sent to people who would have returned anyway train customers to wait for them.
- Measuring opens. Privacy features make opens unreliable; measure returns and orders.
- Never stopping. Keep sending to people who do not respond and your deliverability suffers for the customers who do.
- Treating dormant as churned. Dormant people are inactive for now; churn usually means they ended the relationship, such as cancelling a subscription. They need different handling.
How to plan a re-engagement campaign with TapCub
Here is the grocery store example in TapCub, from choosing the window to reading the result. TapCub does not send emails or push notifications; it tells you who to contact and whether contacting them worked. Sending happens in your email, push or CRM tool.
- See how many people go quiet, and when. In All-platform analytics › Behavior › Behavior analysis, the lifecycle view counts people per week or month as New, Returning, Resurrecting and Dormant. Dormant is drawn as a negative bar in the period after someone's last activity. The inactivity counts show how many people seen in the last 180 days have been inactive for at least 7, 14, 30, 60 and 90 days, which helps you place the window. Guide: read the lifecycle report.
- Build the audience as a rule. In All-platform analytics › Users › Segments & tags, create a rule segment such as "did not do
purchasein the last 60 days" combined with "didpurchaseat least once". Add the random bucket condition to split off a 10% holdout as its own segment. RFM segments offer ready buckets, including "about to sleep" and "hibernating" (create user segments, run RFM analysis). Anonymous visitors have no profile and never join a segment, so identify customers withtapcub.loginfirst. - Hand the list to your sending tool. Segments refresh daily or on demand and record who joined and left; if a webhook is configured, TapCub emits each membership change, which your email or CRM tool can consume.
- Read the result as a comparison. Use Analyze on each segment to apply it as a cohort, then compare the messaged group and the holdout on purchases and on retention over the following weeks. The Resurrecting bar in the lifecycle view shows whether returns rose overall.
FAQ
What is a re-engagement campaign?
A re-engagement campaign is targeted outreach to customers or users who have stopped buying, visiting or opening, meant to bring them back before they leave for good. It usually runs by email, but push, in-app messages, ads and personal outreach also count. It starts with a clear definition of who counts as dormant.
When should you send a re-engagement campaign?
When a customer has been inactive longer than your product's normal gap between visits or orders. Find that point in your data: set the dormant window where about 90% of returns have already happened. For a weekly grocery store that may be 60 days; for a yearly tool it can be a year.
What is a good re-engagement rate?
There is no reliable universal benchmark, because it depends on the window and the product. What matters is the incremental rate: the messaged group's return rate minus a random holdout's. In the sample, 12% of messaged customers returned versus 8% of the holdout, an incremental 4.0 points.
What is the difference between a win-back and a re-engagement campaign?
They are often used as synonyms. When teams separate them, re-engagement usually targets subscribers or users who stopped engaging, and win-back targets paying customers who stopped buying or cancelled. Both need the same groundwork: a dormant window, tiers by value, a holdout and a measure of what happens after the return.
How many emails should a re-engagement campaign have?
Most use two to four messages over two to four weeks: a reminder, something new or an offer for high-value customers, and a final message saying you will stop. Then suppress people who did not respond. More messages rarely help and raise spam complaints, which Gmail asks senders to keep below 0.30%.
See also: What is a push notification? Mobile vs web push and how to measure it.
See also: Product Launch Email: Three-Email Sequence and Benchmarks.
Sources
- Google, Email sender guidelines (spam rate threshold, one-click unsubscribe for bulk senders, unsubscribing inactive recipients). Gmail Help. Checked 2026-11-15.
- Apple, Mail Privacy Protection & Privacy. Checked 2026-11-15.
Was this article helpful?
We use your answers to fix and expand this page.
Couldn’t send. Please try again in a minute.
Thanks for the feedback. We’ll use it to improve this page.You’ve already sent feedback on this page. Thanks.

Product Adoption Consultant
Explores customer onboarding, live conversations, and self-service, turning common usage questions into practical guidance and improvements.