Try it on your own data
Every report in this article is in the free plan. One snippet for web and apps, up to 10 sites.
Start freeMarketing effectiveness is how much of a business result your marketing caused, measured as incremental conversions rather than reported ones. On a sample $100,000 budget, last-click credit puts brand search first at $20 per conversion; counting only conversions the spend caused, it costs $200 and non-brand search becomes the best use of money. This page shows both readings, a holdout test with sample sizes, and how to move budget in steps.
What you will learn
- Effectiveness is incremental conversions; efficiency is the cost of reported ones, and the two can rank channels in opposite order
- A holdout needs a sample size set in advance: about 21,106 per group for 2.0% vs 2.4%
- Move budget in steps by incremental cost per conversion and re-test the channel that receives the money
What is marketing effectiveness, and how is it different from efficiency?
Marketing effectiveness is how much of a business result your marketing actually caused. Efficiency is how cheaply the results you report were produced. A channel can look very efficient (a low cost per conversion) and still be ineffective, because most of those conversions would have happened without the spend.
The cleanest way to hold the two apart is one number: incremental conversions, meaning conversions that happened because of the marketing and would not have happened otherwise.
| Question | Efficiency reading | Effectiveness reading |
|---|---|---|
| What do we measure? | Cost per reported conversion | Cost per incremental conversion |
| Where does the number come from? | Attribution rule, such as last click | A comparison with people who were not exposed |
| What can distort it? | Credit given to activity that was already going to convert | Small samples, short tests, spillover between groups |
| What does it tell you? | Which channel the reports favour | Which spend changes outcomes |
Marketing ROI is the profit-per-dollar view of the same idea, and incrementality is the glossary entry for the concept this page puts to work. The rest of the page compares both readings on one budget so you can see the ranking change.
| Question | Efficiency reading | Effectiveness reading |
|---|---|---|
| What is measured? | Cost per reported conversion | Cost per incremental conversion |
| Where does it come from? | Attribution rule such as last click | Comparison with an unexposed group |
| What distorts it? | Credit for conversions that were coming anyway | Small samples, short tests, spillover |
| What does it show? | Which channel reports favour | Which spend changes outcomes |
Report both, and say which one a budget decision rests on.
Why last-click credit overstates some spend
Last-click credit hands the whole conversion to the final touch. For channels that catch people already looking for you, that is generous.
Two published studies show the size of the gap:
- Brand search. Blake, Nosko and Tadelis ran large field experiments at eBay and found that ads on searches containing the eBay name had no measurable short-term benefit: when the ads were paused, traffic largely moved to free organic results, so substitution between paid and unpaid traffic was nearly complete. They also found that for non-brand keywords, new and infrequent users responded positively while frequent users, who account for most spending, were not influenced, and average returns were negative. Their experimental returns were a fraction of the estimates from non-experimental data. eBay is a very well-known brand; a small advertiser with a competitor bidding on its name can see a different result, which is why you test your own.
- Observational methods. Gordon, Zettelmeyer, Bhargava and Chapsky compared 15 advertising experiments run on Facebook in the US (500 million user-experiment observations and 1.6 billion ad impressions) with several observational methods. The observational methods often failed to reproduce the experimental effect, even after conditioning on extensive demographic and behavioural variables.
Neither study says every channel is ineffective. They say that attributed numbers and caused numbers can differ a lot, and only a comparison with an unexposed group tells you by how much.
One budget, read two ways
Sample data: $100,000 across three channels in a month. Each conversion has a first-order contribution of $150. The last-click report gives each channel's conversions. A holdout test (explained next) shows what share of those would have happened anyway.
| Channel | Spend | Last-click conversions | Share that would have happened anyway | Incremental conversions |
|---|---|---|---|---|
| Brand search | $20,000 | 1,000 | 90% | 100 |
| Non-brand search | $40,000 | 800 | 35% | 520 |
| Paid social | $40,000 | 500 | 20% | 400 |
| Total | $100,000 | 2,300 | 1,020 |
We recomputed both readings:
| Channel | Last-click cost per conversion | Last-click margin per $1 | Incremental cost per conversion | Incremental margin per $1 |
|---|---|---|---|---|
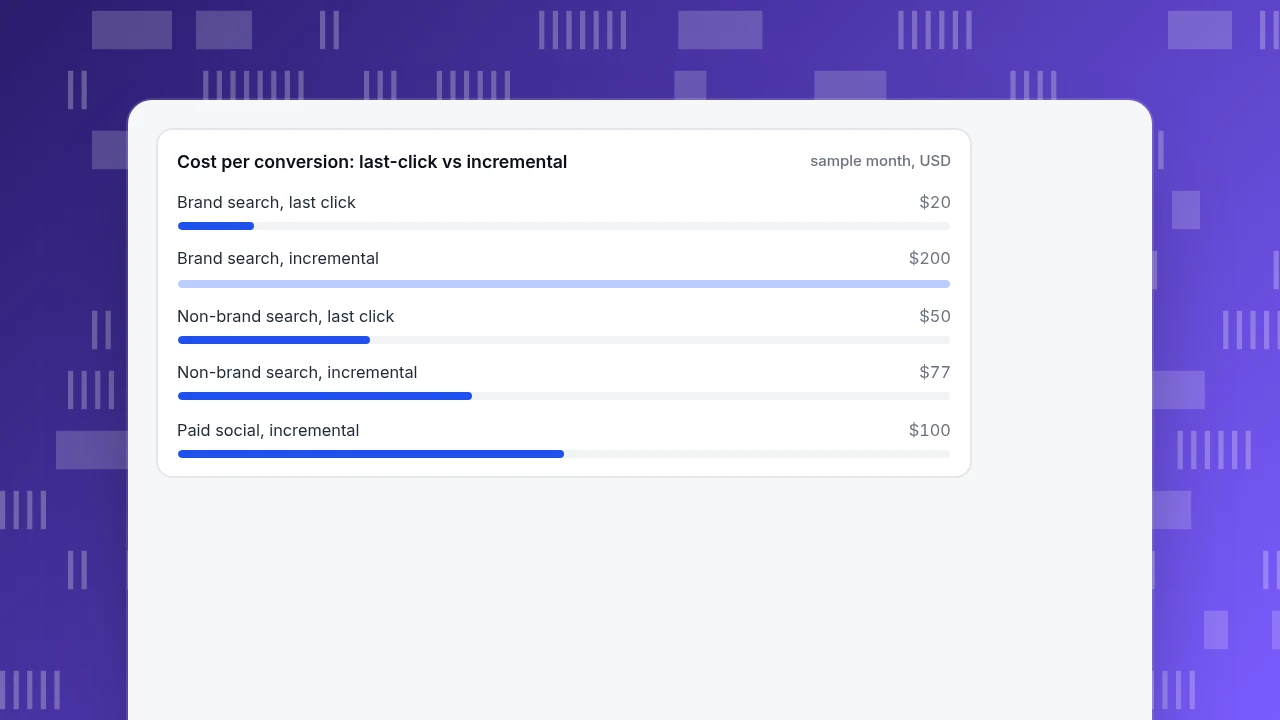
| Brand search | $20.00 | $7.50 | $200.00 | $0.75 |
| Non-brand search | $50.00 | $3.00 | $76.92 | $1.95 |
| Paid social | $80.00 | $1.88 | $100.00 | $1.50 |
| Total | $43.48 | $3.45 | $98.04 | $1.53 |
(Incremental conversions × $150 ÷ spend gives the margin per $1: for brand search 100 × 150 ÷ 20,000 = 0.75.)
The ranking flips. Last click ranks brand search first (2.5 times better than the next channel) and paid social last. Incrementally, non-brand search is the best use of money and brand search is the only channel below break-even ($0.75 back per $1). The total also changes character: a blended cost per conversion of $43.48 becomes $98.04 once you count only conversions the spend caused.
Cost per conversion: last-click vs incremental
sample month, USDHow to measure incrementality with a holdout
The share in the middle column of the table above has to come from a test, not a guess. The method is a holdout:
- Split the audience at random into a treatment group that sees the marketing and a control group that does not. Google describes its conversion lift tool the same way: a treatment and a control group, with the difference in conversions between them being the lift. It also supports geography-based groups.
- Hold everything else equal. Same offer, same period, same landing page.
- Decide the sample size before you start. For a 2.0% baseline conversion rate and a 20% relative lift (2.4%), a two-sided test at 5% significance with 80% power needs about 21,106 people in each group. For a 50% lift (3.0%) it needs 3,823. Small expected effects need big groups; this is why most lift tests on small campaigns come back inconclusive.
- Compute lift = (treatment conversion rate − control conversion rate) ÷ control conversion rate, and incremental conversions = treatment conversions − (control rate × treatment group size).
- Report the interval, not just the point. If the range of plausible lift includes zero, the test has not shown an effect; it has not shown the absence of one either.
The formula for the sample size is n = (1.96 + 0.8416)² × [p1(1 − p1) + p2(1 − p2)] ÷ (p2 − p1)², where p1 and p2 are the control and treatment conversion rates.
What to do when you cannot randomise
Many teams cannot hold out a random audience. In order of reliability:
- Geography holdout. Switch the spend off in a few comparable regions and compare their conversions with similar regions that kept it, before and after.
- Pause test. Turn a channel off for one to two weeks and watch total conversions, not channel-attributed conversions. If total conversions barely move, the channel was mostly claiming credit.
- Before-and-after with controls. Compare the period before and after a change against another metric that the change should not affect, to catch seasonality.
Each of these gives a rougher number than a randomised test. Treat it as a range and keep the notes: what was switched off, where, when and what else changed in the same weeks.
Turning the reading into a budget decision
In the sample, brand search costs $200 for each incremental conversion against $76.92 for non-brand search. Do not move all the money at once, because the next dollar in non-brand search will not buy at its average cost.
Suppose half of the brand budget ($10,000) moves to non-brand search, where extra spend returns conversions at $120 each (a sample assumption, 1.56 times the average):
- Brand search loses 10,000 ÷ 200 = 50 incremental conversions.
- Non-brand search gains 10,000 ÷ 120 = 83.3.
- Net: +33.3 incremental conversions, or +$5,000 of contribution, from the same $100,000. Total incremental conversions rise from 1,020 to 1,053.3.
Four rules follow:
- Rank channels by incremental cost per conversion, not reported.
- Move in steps and re-test the channel that receives the money.
- Keep a small control in every channel. Incrementality changes over time as audiences saturate and competitors change.
- Use last-click numbers for what they are good at, such as day-to-day bid and keyword hygiene, and incremental numbers for budget between channels.
How TapCub helps you read effectiveness
TapCub measures what happens after the click and does not split traffic or run experiments, so the holdout itself is something you run in your ad platform or with regions. TapCub is where you read the result.
- Put spend and results side by side. In All-platform analytics › Business › Channel ROI, import spend on the Costs tab and read cost per acquisition (spend ÷ purchases) and return on ad spend by channel. This is the efficiency reading: the left half of the table above.
- Look at credit under several rules at once. In All-platform analytics › Behavior › Behavior analysis, select first touch, last touch, linear, position and time decay together. Each model is a column. A channel that earns credit under first touch and little under last touch is assisting, which is a reason to test it before cutting it.
- Mark the test dates. Add an annotation under Configuration › Annotations when you pause a channel or turn a region off.
- Compare totals. On Web analytics › Goals, compare total conversions for the weeks before, during and after, not just the channel's own row. For a geography test, compare the matching countries or regions in Web analytics › Audience, which drills from country to region and city.
- Keep the denominator honest. Bots are counted apart from people in TapCub, so they do not inflate sessions in the comparison.
TapCub reads attributed credit and observed totals. It does not compute incremental lift on its own, so the share that would have happened anyway comes from your holdout.
FAQ
What is marketing effectiveness?
It is how much of a result your marketing caused, usually expressed as incremental conversions or incremental revenue per dollar spent. It differs from efficiency, which is the cost of the conversions you report, whether or not marketing caused them.
How do you measure marketing effectiveness beyond clicks?
Compare people exposed to the marketing with a similar group that was not exposed, using a holdout or a geography test. The difference in conversions is the incremental effect. Attribution reports show who got credit, not who was influenced.
Why does last-click attribution overstate brand search?
Because people searching for your name were often going to reach you anyway. In eBay's experiments, pausing brand ads moved traffic to free listings and left near-complete substitution. The conversions are real but the spend did not cause them.
How big does a holdout test need to be?
It depends on the effect. For a 2.0% baseline and a 20% relative lift, about 21,106 people per group at 80% power and 5% significance. For a 50% lift, about 3,823 per group. Smaller effects need much larger groups.
Can I measure incrementality without a randomised test?
Roughly, yes: a geography holdout, a pause test of one to two weeks, or a before-and-after comparison against a control metric. Treat the result as a range, and keep notes on what changed so you can explain it.
Sources
- Thomas Blake, Chris Nosko and Steven Tadelis. Consumer Heterogeneity and Paid Search Effectiveness: A Large-Scale Field Experiment. NBER Working Paper 20171 (published in Econometrica, 2015) — brand keyword ads showed no measurable short-term benefit; non-brand returns were negative on average; experimental returns were a fraction of non-experimental estimates. Checked 2026-11-20.
- Brett Gordon, Florian Zettelmeyer, Neha Bhargava and Dan Chapsky. A Comparison of Approaches to Advertising Measurement: Evidence from Big Field Experiments at Facebook. Marketing Science 38(2), 2019 — 15 US experiments, 500 million user-experiment observations and 1.6 billion impressions. Checked 2026-11-20.
- Google Ads Help. About Conversion Lift — treatment and control groups, lift as the difference in conversions, user-based and geography-based studies. Checked 2026-11-20.
Was this article helpful?
We use your answers to fix and expand this page.
Couldn’t send. Please try again in a minute.
Thanks for the feedback. We’ll use it to improve this page.You’ve already sent feedback on this page. Thanks.

Product Adoption Consultant
Explores customer onboarding, live conversations, and self-service, turning common usage questions into practical guidance and improvements.